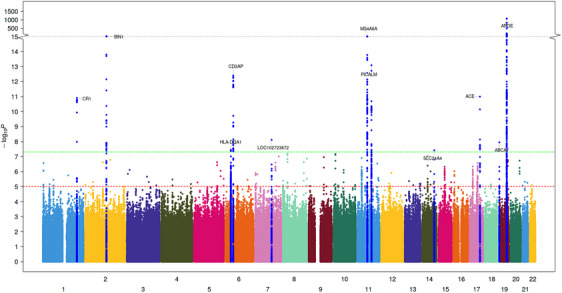
FIGURE 1.

Manhattan plot of ACD GWAS. In addition to variants in APOE region, we identified five new genetic loci associated with VaD. Blue and red lines correspond to p value of 5e−7 and 5e−8 for genome‐wide suggestive and significant SNPs, respectively. Manhattan plots for the cross‐ancestry meta‐analysis. Each dot represents a SNP, the x‐axis shows the chromosomes where each SNP is located, and the y‐axis shows −log10 p value of the association of each SNP with ACD in the cross‐ancestry meta‐analysis. The red horizontal line shows the genome‐wide significant threshold (p value = 5e‐8; −log10 p value = 7.30). The nearest gene to the most significant SNP in each locus has been labeled.
