
Figure 5.
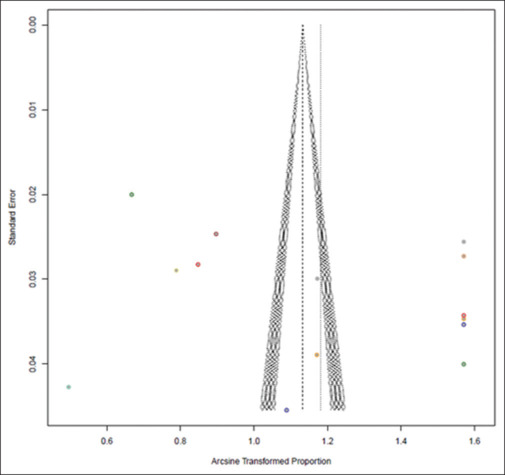
Funnel plot representing publication bias among the included studies. The X-axis is represented by the proportion of the arcsine transformation of the study fraction, and the standard error represents the Y-axis. Symmetry of funnel plot is established. The outliers in the study are represented in dotted colour, and their associated asymmetry is depicted, contributing to the heterogeneity of studies