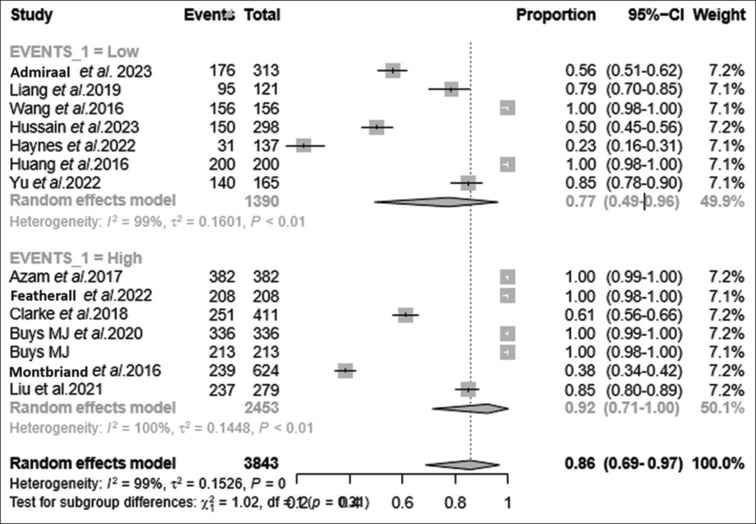
Figure 6.

Subgroup analysis based on forest plot for event occurrence. Forest plot portraying subgrouping of sample size based on the events (high-occurrence vs. low-occurrence events) among the studies evaluated. TPS feasibility was estimated to be 77% among studies with low occurrence of events (PPSP, PCS), whereas the feasibility attained 92% among studies with high occurrence of events (PPSP, PCS). The overall feasibility of TPS was 86% on the random effects model. PCS = pain catastrophising, PPSP = persistent postsurgical pain, TPS = transitional pain service
