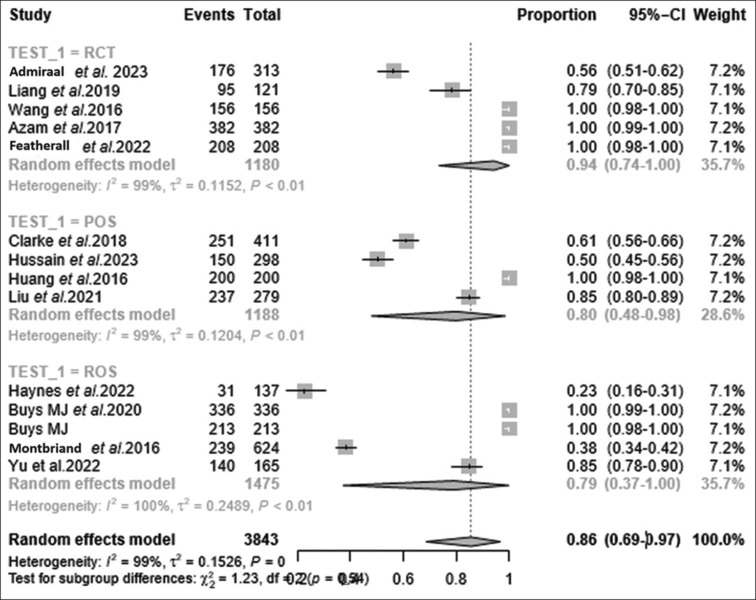
Figure 7.

Subgroup analysis based on forest plot portraying subgrouping by detection techniques based on the study type involved. Random effects model depicting efficacy proportions for each study subtype involved. Feasibility of TPS was estimated among studies involving RCT at 94%, POS at 80% and ROS at 79%. CI = confidence interval, POS = observational studies based on prospective cohort population, RCT = randomised controlled trial, ROS = observational studies based on mixed cohort population, TPS = transitional pain service
