Abstract
Purpose
In the past few decades, the prevalence of myopia, where the eye grows too long, has increased dramatically. The visual environment appears to be critical to regulating the eye growth. Thus, it is very important to determine the properties of the environment that put children at risk for myopia. Researchers have suggested that the intensity of illumination and range of distances to which a child's eyes are exposed are important, but this has not been confirmed.
Methods
We designed, built, and tested an inexpensive, child-friendly, head-mounted device that can measure the intensity and spectral content of illumination approaching the eyes and can also measure the distances to which the central visual field of the eyes are exposed. The device is mounted on a child's bicycle helmet. It includes a camera that measures distances over a substantial range and a six-channel spectral sensor. The sensors are hosted by a light-weight, battery-powered microcomputer. We acquired pilot data from children while they were engaged in various indoor and outdoor activities.
Results
The device proved to be comfortable, easy, and safe to wear, and able to collect very useful data on the statistics of illumination and distances.
Conclusions
The designed device is an ideal tool to be used in a population of young children, some of whom will later develop myopia and some of whom will not.
Translational Relevance
Such data would be critical for determining the properties of the visual environment that put children at risk for becoming myopic.
Keywords: optogenetics, retinal gene therapy, photoreceptor degeneration, MCO-010
Introduction
The growth of the eye in early childhood is regulated by emmetropization, a process by which eyes outgrow their neonatal refractive errors—whether hyperopic or myopic—to attain an appropriate length given their optical (refractive) power.1,2 In recent years, however, this process has been failing in more and more children. As a result, the prevalence of myopia has increased substantially.3,4 Myopic eyes are too long given their optical power, which results in blurred distance vision unless corrected with spectacles or contact lenses. The increase in the prevalence of myopia has been too rapid to be explained by a change in genetics alone. Rather it must be due, at least in part, to changes in the visual environment and children's interaction with that environment.5
Decades of research involving animal models have shown convincingly that the visual environment does indeed play a key role in emmetropization.2 The research has shown that chickens, guinea pigs, marmosets, tree shrews, and more detect signals from retinal images that guide the growth of the developing eye.6 For example, placing a negative lens in front of a young animal's eye (which produces images that are generally behind the retina) causes the eye to grow long and become myopic, whereas placing a positive lens before the eye (producing images in front of the retina) causes the eye to grow less and become hyperopic.6,7 In addition, the intensity8–11 and spectral composition12 of the lighting environment in which animals are raised have been shown to affect eye growth and the likelihood of developing myopia.
Our understanding of the critical properties of the visual environment as they relate to the development of myopia in humans is poor. A significant limitation to gaining better understanding is the fact that one cannot ethically manipulate the visual environment of children as one can in animal studies. Furthermore, the conditions under which animals are reared in the laboratory do not mimic the natural environment in which children are raised. As a consequence, researchers have had to make indirect inferences from natural experiments in which one set of children happens to have been exposed to a different environment than another (eg, denser housing13). This approach is, unfortunately, subject to confounds because children in the two groups may differ in other ways that may be known and cannot be factored out or are simply unknown. Another problem concerns how to quantify a child's visual environment. This has often been done with subjective reports (ie, parental questionnaires). Such data are potentially flawed in that parents may not know exactly how their children spend their time or may be biased in reporting it.14,15 Nonetheless, these studies have yielded some insights. For example, children who spend more time outdoors are less likely to develop myopia, as reported in both cohort studies16 and randomized control trials.17,18 The outdoor environment differs from the indoor environment in the intensity and spectral composition of illumination and also in the distances of objects in the visual field. This leads to the hypothesis that the statistics of illumination and/or distance are a predictor of who will develop myopia. But without measuring such statistics directly in young children, one cannot assess their potential importance. Wearable technologies have been used to make such measurements in children, but, as we describe in the next section, they have not to date enabled the collection of the statistics we need to better understand risk factors. Thus, there is a compelling need to measure the visual environments of children comprehensively before they develop myopia. Such measurements should be made with a mobile device that does not prevent children from engaging in their everyday activities. The measurements should be made across a wide range of distances, including close distances because children spend significant time fixating near objects. Such distance measurements should be made across a reasonably wide field of view because of evidence that non-foveal retinal images (ie, in the near periphery) play a role in eye growth.19 Measurements should also be made of the intensity and spectral distribution of illumination approaching the eyes, and those measurements should be valid both indoors and outdoors.
Previous Mobile Devices
As we said, other researchers have appreciated the need for such measurements and have developed mobile devices for measuring illumination and distances. We briefly review their specifications next.
Actiwatch: https://www.usa.philips.com/healthcare/product/HC1044809/actiwatch-2-activity-monitor. Actiwatch is a wrist-worn device that records ambient illuminance and physical activity at 32 hertz (Hz)20–22 Illuminance measurement range is 0.1 to 35,000 lux. The device has three light sensors, each sensitive to a different band of wavelengths. But in published work the measurements from the three sensors have been combined so the spectral distribution of the illumination cannot be determined. Activity is measured using an accelerometer. The device is no longer manufactured.
FitSight: FitSight is an illuminance-measuring device worn on the wrist.23,24 It is housed in a Sony Smartwatch 3. Software consists of a custom FitSight app on the watch and a companion app running on a smartphone. FitSight measures and records illuminance levels at 1-minute intervals and calculates the amount of time spent outdoors from the amount of time the illuminance exceeds a predefined value. The device has only one light sensor so it cannot estimate the spectral distribution of the illumination.
HOBO Pendant Light Meter: https://microdaq.com/onset-hobo-pendant-temp-light-data-logger.php. The HOBO Pendant Light Meter is a lightweight device worn on the upper arm or chest that measures illuminance and temperature.14,20,25–28 The manufacturer states that it measures illuminance every 5 minutes over a range of 0 to 320,000 lux. Its light sensor has a very broad spectral range (peak sensitivity at 900 nm). Because it has only one sensor, it cannot estimate the spectral distribution of the illumination.
Clouclip: https://www.clouclip.com/webCarbon/pc.html. Clouclip is a small, lightweight range-finding device that is mounted on the right temple of a spectacle frame.29,30 It uses infrared light to measure distance every 5 seconds. The field of view is 25 degrees in diameter. The center of the field is pitched 10 degrees downward. The device returns one distance estimate with each measurement, so it cannot distinguish between scenes containing different variations in depth. The manufacturer states that it can measure distances of 5 to 120 cm accurately. Bhandari and Ostrin26 conducted a validation study of Clouclip's distance estimation. They presented frontoparallel planar surfaces of different sizes at different distances. They reported that estimates were accurate for distances of 5 to 100 cm, but that accuracy depended on the size of the target. Specifically, the target object had to occupy at least 1.5% of the beam for its distance to be measured accurately. They also reported that distance estimates were mostly unaffected by the slant of the planar surface, which is consistent with the fact that it returns one average distance in the scene. Clouclip also measures ambient illumination. The manufacturer states a measurable range of 1 to 65,336 lux. The device has only one light sensor so it cannot estimate the spectral distribution of the illumination.
RangeLife: https://www.adafruit.com/product/3317. RangeLife measures distance with of time-of-flight system whose source is an infrared laser.31 The manufacturer states that it can return accurate estimates for distances of 5 to 120 cm, but the range depends on the lighting environment (eg, indoor versus outdoor): less accuracy in brighter environments. The device can be attached to the user's spectacles. It measures the distance of the object that is illuminated by the infrared source, providing just one estimate per time period. Thus, it cannot be used to determine the 3D structure of the scene in front of the user at a given time.
Vivior: https://vivior.com/product/. Vivior is a small device that can be attached to spectacle frames that measures distance and illumination.32 To our knowledge, there is no publicly available information about what principles are used to measure distance and illuminance and therefore no information about the measurable ranges of distances and illuminances. There is also no information about the number of illumination sensors nor whether it can measure 3D structure of the environment in front of the user.
Kinect + Tracker: Garcia and colleagues33 developed a custom device that measures distances and eye fixations. It is mounted on a helmet worn by the user. The device measures distances with a Kinect (https://en.wikipedia.org/wiki/Kinect), which uses structured light emitted by an infrared source. It has a field of view of 57 degrees × 43 degrees. The structured-light technique allows accurate measurements of distances from 40 to 450 cm. But it does not allow measurement in many outdoor scenes because they have high levels of ambient infrared light. The device also tracks eye movements, which enables the measurement of distances in retinal coordinates.
Scene + Eye Tracker: Read and colleagues34 developed a mobile device that measures distances across a wide field of view as well as binocular eye fixations. The device consists of a Pupil Labs eye tracker35 for measuring fixations and an Intel RealSenseD435i depth camera for measuring distances. The device works across a wide range of distances (see Methods: Hardware) and in indoor and outdoor environments. It does not measure illumination. To date, Read and colleagues have only published data from young adults performing various reading tasks.
Another Scene + Eye Tracker: Banks and colleagues36–39 developed a custom mobile device that measures distances across a wide field of view and binocular eye fixations while people perform everyday tasks. The device measures distance using stereo cameras. The fixation data are registered with the camera data to determine the 3D structure of the scene in front of the user in retinal coordinates. Different versions of the device have been built, but they all require a helmet containing the stereo camera and eye tracker, and a backpack containing the host computer and a battery. The helmet weighs about 2 kg and the backpack 10 kg. The device provides rich data, but is impractical for use with children.
In summary, a number of mobile devices have been used to measure illumination and distance. None provides measurement of the spectral content of the illumination. In addition, with the exception of the custom devices of Garcia and colleagues33 and Read and colleagues,34 none provides estimates of distances across the central visual field from which one can determine the variation in distances to which the user is exposed. The Garcia device is not very useful in the outdoors. The Read device is expensive and has not been tested in children. Our inexpensive, lightweight, mobile device provides measurement of the spectral content of illumination and the distance variation across a wide central visual field as a child engages in everyday indoor and outdoor activities.
Methods
Hardware
Our goal was to produce an inexpensive device that is easy to reproduce and use. All electronic components and sensors are available off the shelf. The bicycle helmet is a standard design for children and is available worldwide. The Supplementary Section provides a detailed parts list and their prices at the time of publication. The estimated total cost, not including labor, is $530. The low cost is essential for the intended use of the device in studies of populations of children. The components that attach to the helmet and computer case are custom 3D-printed parts; their design is publicly available along with assembly instructions at https://osf.io/43ut5/.
Helmet
Our device is mounted on a commercial children's bicycle helmet (see Fig. 1). It contains the Intel RealSenseD435i, which has a red, green, and blue (RGB)-and-depth camera and an inertial motion unit (IMU). Our device also contains a spectral sensor: the Adafruit AS 7262.
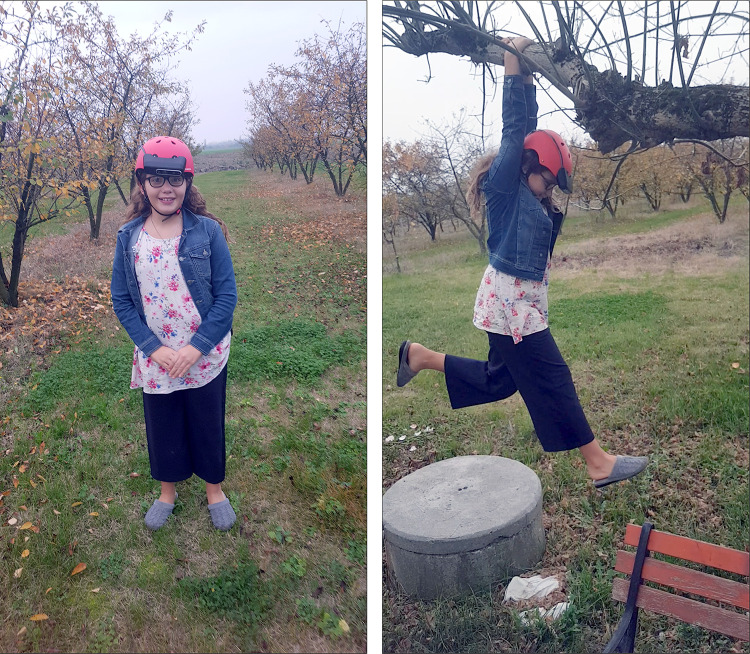
Figure 1.
Our device being used by a child. The left panel shows the fit of the device on the head. The right panel shows how it allows freedom of movement.
Intel RealSense D435i: The D435i is small (90 × 25 × 25m m) and light (72 grams), making it ideal for mounting on a helmet. It measures distance using a pair of infrared cameras and an infrared emitter. The emitter projects a 2D noise pattern that provides texture on reflecting surfaces. This greatly enhances the robustness of the stereo-matching algorithm, particularly for surfaces that are otherwise uniform. The infrared cameras have global shutters, making them robust to image motion. The resulting depth sensor has a field of view of 87 degrees × 58 degrees (±3 degrees) and provides robust distance measurements between 0.12 and 10 m with high accuracy (<2% at 2 m). More details about the accuracy of distance measurements are provided in an Intel white paper.40 Although distance measurements at high spatial (1280 × 720 pixels) and temporal (90 Hz) resolution are feasible, we chose to use lower resolutions for our application to enable longer periods of data collection. The D435i has a six degree-of-freedom IMU. The accelerometer provides data at 250 Hz and the gyroscope at 200 Hz. The D435i is connected to the host computer with a USB3.1 cable. It can also use a USB2.0 cable if it is run at lower spatial and temporal frequencies.
Adafruit AS7262: The AS7262 is a small (12.5 × 14 mm), lightweight (<10 grams) visible-light sensor that is ideal for helmet mounting. It has six sensing channels that are well distributed across the visible spectrum with peak sensitivities at 450, 500, 550, 570, 600, and 650 nm (violet, blue, green, yellow, orange, and red, respectively). Data are acquired at 15 Hz. The field of sensitivity is a cone with a 40-degree diameter. The AS7262 is connected to the host computer through an I2C interface using a standard 4P4C telephone cable. It measures irradiance, so to convert its measurements to illuminance, one needs to incorporate Vλ, the visual system's spectral sensitivity.
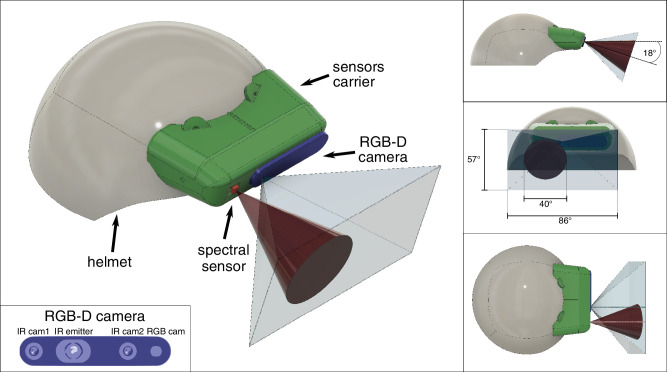
Mount for Sensors: The sensor mount was designed to be robust and comfortable, as is required for usage with children. We created a 3D model of the helmet using Dot3D software by Dot Product. An interlocking guide was designed to snap into the helmet ventilation holes, thus preserving the structure of the original helmet. The sensor mount snaps into the guide and seamlessly continues the shape of the helmet (Fig. 2).
Figure 2.
Schematic of the device. The left panel shows the helmet (gray) with the sensor mount (green), the spectral sensor (red) and its field of view (brown cone), and the RealSense camera (blue) and its field of view (light gray frustum). The inset shows the layout of one RGB and two infrared cameras and infrared emitter on the RealSense device. The right panels show the device from different perspectives: the side view in the upper panel, the front view in the middle panel, and the top view in the bottom panel. The panels show the downward pitch of the device and the fields of view of the sensors. Note that the fields of view of the two sensors overlap substantially at longer distances.
The D435i is mounted such that its reference frame is aligned with the mid-sagittal plane of the head. The AS7262 is mounted adjacent to the D435i, so that the fields of view of the 2 sensors can be aligned and overlap as much as feasible. In everyday activities, people tend to look down.36,37 Thus, we aimed the 2 sensors 18 degrees downward to take into account the likely gaze directions. The sensors are positioned as close as possible to the eyes to minimize parallax mismatches.41–43
The helmet and sensor attachments are strong, making the device sufficiently robust for use with active young children (see Fig. 1).
Host Computer
To run the depth camera and spectral sensor, we used a single-board microcomputer: the Raspberry Pi (3B+ version). This computer has reasonably high computational power (Cortex-A53 [ARMv8] 64-bit 1.4 GHz and 1 GB LPDDR2 SDRAM) and low power consumption (1.7 W with HDMI and WiFi off). The Raspberry Pi has USB 2.0 ports, which allowed us to collect data with sufficiently high spatial (424 × 240 pixels) and temporal resolution (6 Hz) for the purposes of the project.
The Pi board is powered by a hat UPS board (Geekworm X728), which allows for free access to the whole pinout. The board hosts two 3.7 Volt lithium ion batteries (IMR 18650) with 3500 mA capacity each and 4 LEDs that display battery-charging status. It delivers a 5.1 V 6A current, which is sufficient for the power requirements of the Raspberry Pi 3B+ and Intel D435i. During usage, 2 cables are connected to the host computer: the USB cable for the depth camera and a 4P4C telephone cable for the spectral sensor. During recharging, a door can be opened to plug the power supplier to the UPS hat board. During maintenance, the device can be operated over WiFi via ssh or connected to an HDMI output.
A custom 3D-printed case is used to shelter the host computer and lock the cables. A push button is accessible using a custom shape pin, and is used to turn the device on and off. The case has a belt loop to safely and firmly secure it to the wearer's waist.
Software Architecture
The operating system is the Raspberry Pi OS 2020-08-20, which corresponds to the Linux Kernel version 5.4.51. The image of the OS with the software installed is available for download at https://osf.io/43ut5/.
The device automatically starts recording at startup. The event detection on activation of the on-off switch and the launch of the acquisition software are regulated by a shell script. Acquisition is controlled by a script written in Python 3.6, which relies on the following Python packages:
-
•
Intel RealSense SDK 2.39.0, to control the D435i.
-
•
OpenCV 3.4.2, to handle image writing and image display during debugging.
-
•
CircuitPython, to operate the Adafruit AS7262.
-
•
Thread, to handle asynchronous data acquisition.
During acquisition, the control of the red and green on-board LEDs is over-ridden and they are flashed alternately to signal the ongoing recording. The D435i cameras run at 6 Hz, whereas the IMU sensors run at 200 Hz (gyroscope) and 250 Hz (accelerometer). To handle asynchronous reading from the two components, two pipelines are created, one for the cameras and one for the IMU. To handle asynchronous data acquisition from the D435i and the AS7262, each is controlled by a different thread, launched in Python.
Color images are saved every 10 seconds at 640 × 480 pixels resolution to monitor the ongoing acquisition. Depth data are saved at 6 Hz: 480 × 270 pixels as 16-bit gray-scale images, where each level corresponds to one millimeter, thus potentially encoding distances between 0 and approximately 65.5 m. Data from the gyroscope, accelerometer, and spectral sensor are saved in txt files. With this configuration, 1 hour of recording corresponds to approximately 1.1 GB of data.
Device Testing
Following development of the prototype, calibration and pilot data were collected as detailed below.
Spectral Sensor Calibration
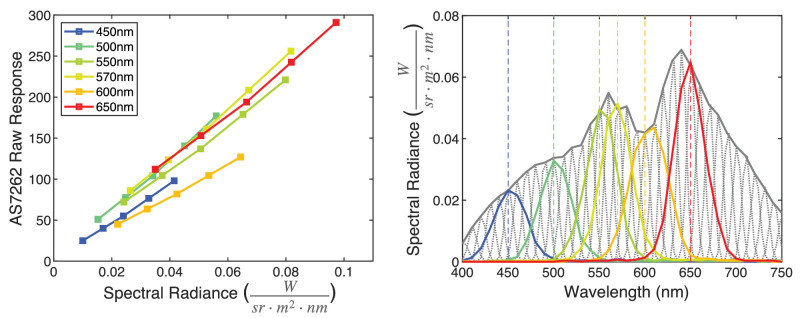
To determine the accuracy of the AS7262 spectral sensor for measuring the light spectrum, we performed a custom procedure. We used a monochromator to create a light source with known intensity and wavelength: specifically, to generate narrow-band light in 10 nm steps from 380 to 780 nm. The properties of the light source were measured with a Photo Research PR-650 SpectraScan Colorimeter. At each wavelength, we presented five intensities to the spectral sensor (Fig. 3, right panel). The AS7262 returns an integer value from 0 to 64 for each color channel. The left panel of Figure 3 shows the response of each color channel of the AS7262 to the 5 intensities. The responses were proportional to the intensity of the light source. Data from the colorimeter were then used to convert the integer values into spectral radiance. The right panel of Figure 3 shows that the responses of the 6 AS7262 channels have peaks at their stated wavelengths (450, 500, 550, 570, 600, and 650 nm) and provide an excellent representation of the spectrum of the light source. Again, we note that the device measured irradiance, not illuminance. To convert to illuminance, one needs to take the visual system's spectral sensitivity into account.
Figure 3.
Calibration of the AS7262 Spectral Sensor. The left panel shows the raw data from the AS7262 plotted against the radiance presented at each of 6 wavelengths that correspond to the peak sensitivities of the 6 spectral channels. Five intensities were presented at each wavelength. The right panel shows the spectral radiance of the emitted light from the light source (gray dotted curves) for presentation in 10 nm steps from 380 to 780 nm. The gray solid line is the envelope of those source intensities. The colored lines represent the responses of each channel.
Is Eye Tracking Needed?
We realized that incorporating eye tracking would add significantly to the complexity, cost, and difficulty of use of the device. Therefore, we conducted an experiment to determine how much is gained by eye tracking when one wants to know the distance of fixation and to points around fixation. We did this by using the scene and eye tracker developed by Gibaldi and Banks.37 We had four adults engage in a variety of natural activities, some indoors and some outdoors. In one condition, we measured the distances of points in the scene in front of the subject and coupled those measurements with binocular eye tracking that told us the distance to which the eyes were converged. We observed that most gaze directions fall within 10 degrees to 15 degrees of straight ahead and slightly down.36,44 In the other condition, we made the same measurements of distances to scene points in front of the subject but did not include the eye-tracking data. Instead, we assumed that the subjects were fixating the scene point that was straight ahead and downward by 18 degrees.
The data are shown in Figure 4. The blue and red curves show the distribution of estimates of fixation distance with and without eye tracking, respectively. The curves are very similar. From this result, we concluded that incorporating eye tracking was not worth it: specifically, it would not provide enough added information to justify the additional cost, weight, and complexity. Therefore, the device we developed did not include eye tracking.
Figure 4.
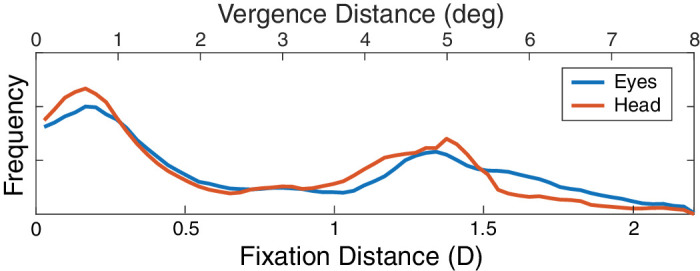
Estimates of fixation distance. The frequency of occurrence is plotted as a function of fixation distance estimated in two ways: (1) by measuring distance to points in the scene ahead and binocular eye fixation to determine the distance of the fixated point, and (2) by assuming that the fixated point was in the head's sagittal plane and 18 degrees downward. The former is represented by the blue curve and the latter by the red curve. The lower abscissa represents fixation distance in diopters. The upper abscissa represents the corresponding convergence angle in degrees.
Data Collection at the Head Versus Wrist
Previous studies placed illumination sensors on the wrist (Actiwatch)21,45–47 (Fitsight)23 or around the neck (HOBO).17 The assumption has been that recordings from the wrist or chest are a good approximation of illumination at the eyes. We tested this assumption by having one adult wear 2 AS7262 devices at the same time: one on the helmet and one on the wrist. We synchronized the data from the 2 devices by first making measurements in an environment in which we alternated between light and dark every 30 seconds. The data were then synchronized to match the rise and fall of the signals from the two sensors. For the experiment, the subject performed various activities, each for 5 minutes. The activities were working on a computer, using a smartphone, doing home chores, and walking outside. After data collection, we confirmed that the two devices were still recording the same illuminances by conducting a post test. In this test, the two devices were placed side by side on the wrist and oriented in the same direction. They generally recorded the same illuminance in the post test.
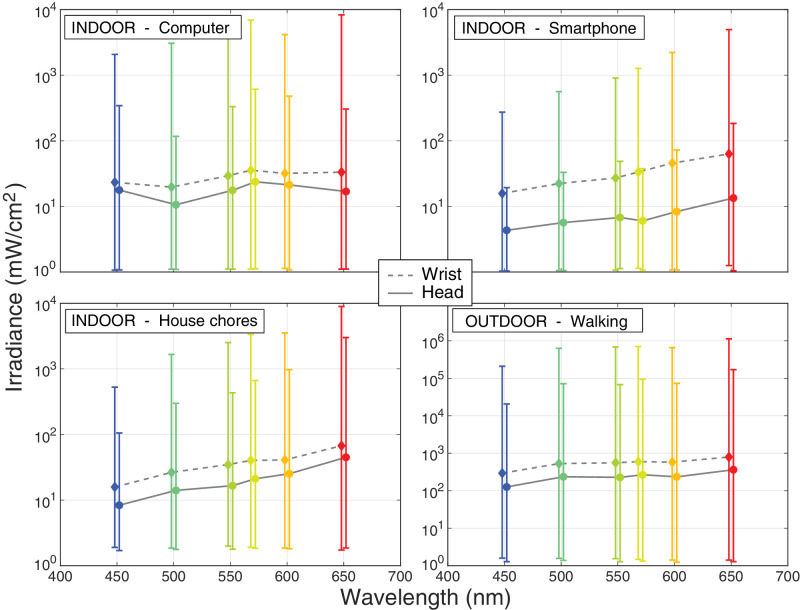
Figure 5 shows the results obtained from the 4 activities. Each plot shows the median irradiance values for the six spectral channels according to the two sensors. Note that the scale is different for the outdoor activities than for the indoor ones. The measurements from the wrist were generally higher than those from the head. Specifically, irradiance measured at the wrist was on average 124% higher than irradiance measured at the head. (The difference was greater for the smartphone activity where irradiance at the wrist was 401% higher. Note that, given the small size of the smartphone with respect to the field of view of the spectral sensor, the background would have an impact on the measured irradiance.) In general, the lower irradiance measured at the head was probably due to the subject choosing to orient the head (and therefore the eyes) away from bright sources. The variation in irradiance from one wavelength to the next was quite similar between the wrist and head: for all activities, measured irradiance was greater at long wavelengths than at short. Finally, the measurements from the wrist had greater variance than those from the head.
Figure 5.
Irradiance measured at wrist and head in indoor and outdoor environments. Log of median irradiance is plotted for each of the six sampled parts of the spectrum. Three panels plot the data from indoor activities and one plots data from an outdoor activity. Diamonds and dashed lines represent the data from the AS7262 on the wrist. Circles and solid lines represent the data from the AS7262 on the head. Error bars represent the interquartile ranges.
We conclude that measurements of illumination of the wrist tend to overestimate the illumination approaching the eyes. Therefore, we decided to design our device to measure illumination at the head.
Results
Pilot Data
We collected data with our device in 2 children, 7 and 10 years of age. Each child wore the device over four recording sessions (each approximately 1 hour), performed on different days while engaging in normal indoor and outdoor activities. In the first session, we first described the device and its usage to the children and their caretakers. They were encouraged to ask questions. We next showed how to fit and secure the helmet. We then obtained written consent from the caretaker and assent from the child. None of the children or caretakers reported discomfort, trouble navigating the device controls, or inability to perform everyday activities while wearing the device.
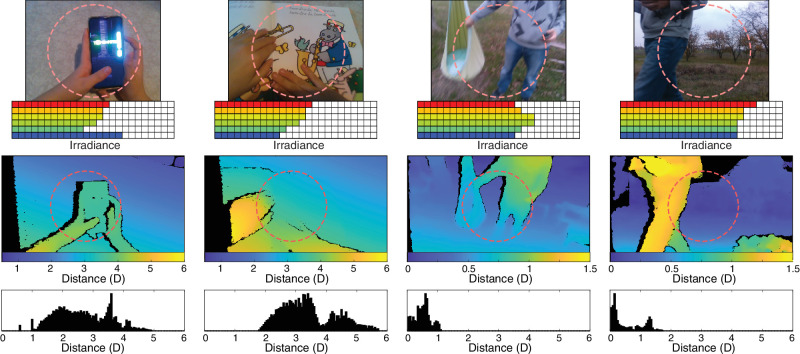
Figure 6 provides examples of the data we were able to collect for 2 indoor activities (the 2 left columns) and 2 outdoor activities (2 right columns). The top row shows images from the RGB camera. The second row shows the irradiances measured by each of the spectral channels. The third row shows the distances (blue is farther and yellow is nearer) over a wide field of view (87 degrees × 58 degrees), estimated for the corresponding scenes in the top row. The fourth row provides histograms of the distances from those scenes. Not surprisingly, the irradiances are lower and the distances nearer in the indoor activities than in the outdoor ones.
Figure 6.
Example data from our device. The two left columns are data from indoor activities and the two right columns data from outdoor activities. The top row shows images from the RGB camera, which has a field of view of 69 degrees × 42 degrees. The dashed circles represent the field of view of the spectral sensor. We do not store RGB images from actual experimental sessions to avoid privacy issues; they are shown here only as examples. The second row shows irradiances from the above scenes from the six channels of the spectral sensor. The third row shows distances in diopters from the scenes above measured by the depth camera. Blue represents farther points and yellow nearer ones. Note the change in scale between the indoor activities on the left and outdoor activities on the right. Black regions in these panels represent areas where distance computation was not reliable due to occlusions or reflections. The field of view of the depth camera was 87 degrees × 58 degrees, which is somewhat larger than that of the RGB camera. The dashed circles again represent the field of view of the spectral sensor. The bottom row provides distance histograms for the scenes above, where distance is again expressed in diopters.
We now turn to more extensive data we collected to assess the usefulness of our device.
Illumination
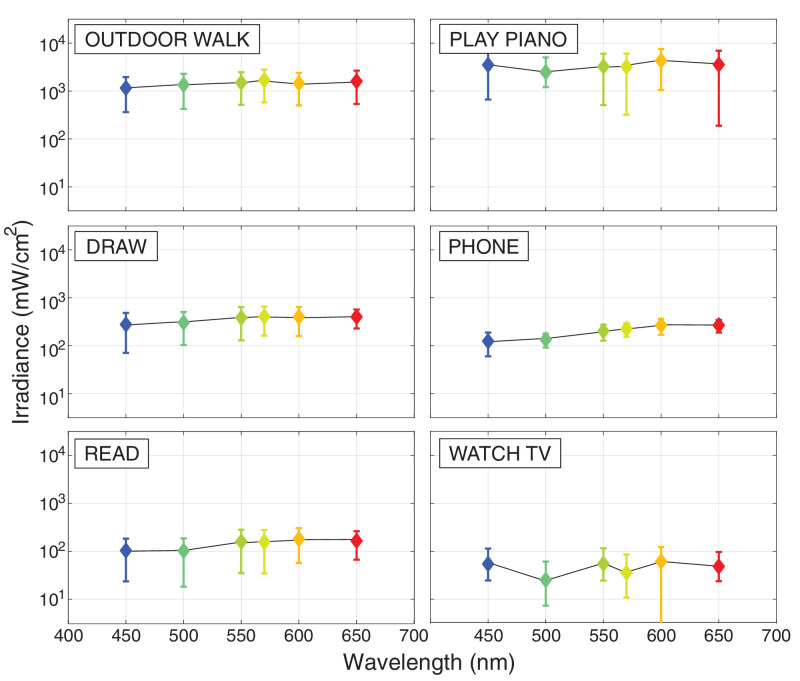
During data collection, the children engaged in 14 indoor activities and four outdoor activities. Figure 7 summarizes the illumination data from a representative sample of 5 of the indoor activities and 1 of the outdoor ones. The panels plot median irradiance for six wavelengths. Unsurprisingly, the outdoor walk activity had higher irradiance than four of the indoor activities. Surprisingly, the indoor piano activity also had high irradiance. This was due to the fact that the piano was positioned near a window during daytime so the sheet music and piano were brightly illuminated.
Figure 7.
Illumination statistics for six activities. Each panel shows the median irradiance for six wavelengths for one activity. Subject 1 provided data for an outdoor walk, drawing, reading, and using a phone. Subject 2 provided data for an outdoor walk, reading, playing the piano, and watching the TV. Error bars represent 25% and 75% quartiles.
Figure 8 summarizes the illumination results by combining the data from the indoor activities separately from the data from the outdoor activities. As expected, irradiance outdoors was greater and less variable than indoors. Variation across wavelength was similar in the two environments with a tendency for greater irradiance at longer wavelengths outdoors.
Figure 8.
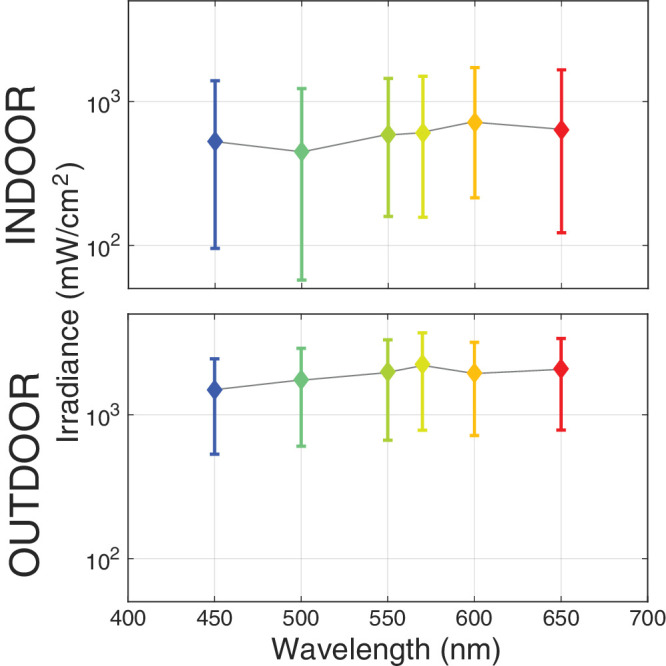
Spectral composition of indoor (top panel) and outdoor (bottom panel) light environments. Log median irradiance values are plotted for the six sampled parts of the spectrum. Error bars are standard deviations. Data were collected from two children as they engaged in indoor and outdoor activities. The indoor data come from 14 tasks and the outdoor data from 4.
These illumination results show that our device is able to collect useful data on lighting as it approaches the eyes across a variety of everyday indoor and outdoor activities.
Distances
We next turn to the distance data. They were collected in the same two children as the illumination data while they engaged in the same activities.
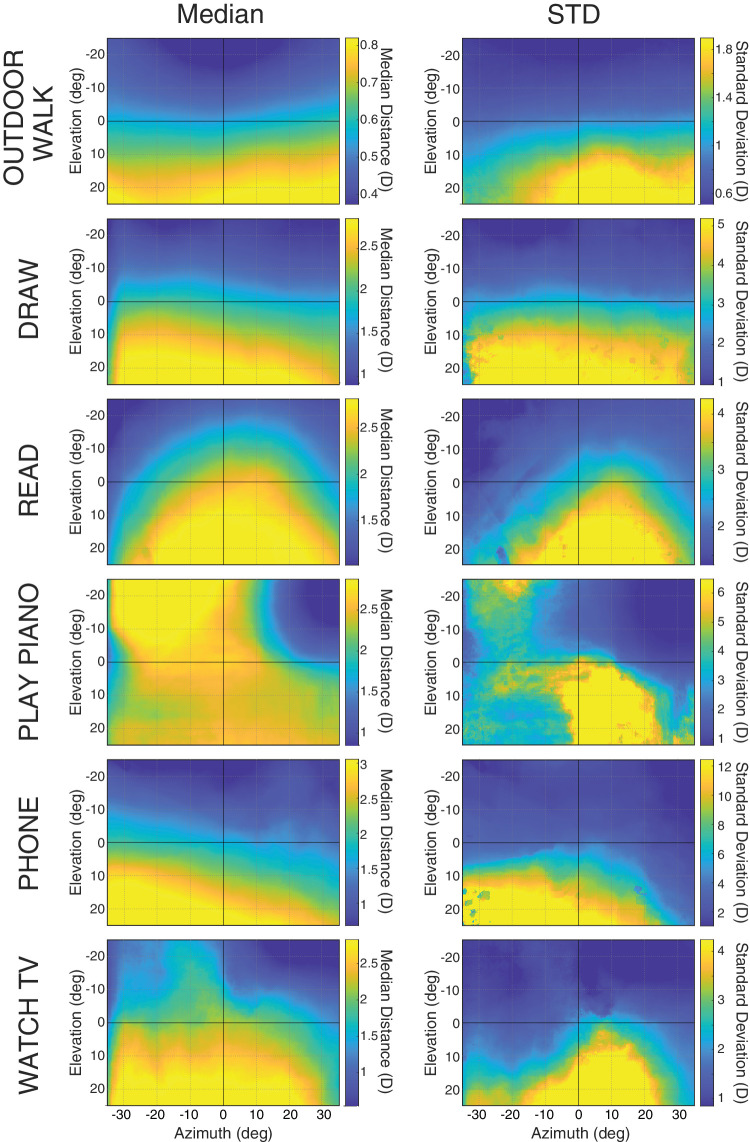
Figure 9 summarizes the data from a representative subset of the indoor and outdoor activities. The left panels plot the median distances in diopters (D) in the scene in front of the child. Blue represents farther distances and yellow nearer distances. The right panels plot the standard deviations of those distances with blue representing less variance and yellow representing more. Not surprisingly, the outdoor activities exhibited greater distances and less variance than the indoor ones. The lower field exhibited nearer distances (approximately 1 D nearer) and more variance (approximately 1 D more) than the upper field in all activities except piano playing where the sheet music was frequently in the upper left field.
Figure 9.
Distance statistics for six tasks. The left panels show the median distances across the central field. Elevation and azimuth are in head-centric coordinates, so the center of each panel represents a point in the head's sagittal plane and downward by 18 degrees relative to the head's transverse plane. The color bars on the side of each panel show the range of distances for that panel. Note the change in scale for the outdoor data compared to the indoor. The right panels show the standard deviations of those distances. Again, the color bars show the range of standard deviations for the corresponding panel. Note the change in scale for the outdoor data compared to the indoor. From top to bottom, the data in this figure are from the outdoor walk activity, drawing, reading, playing the piano, using the phone, and watching television.
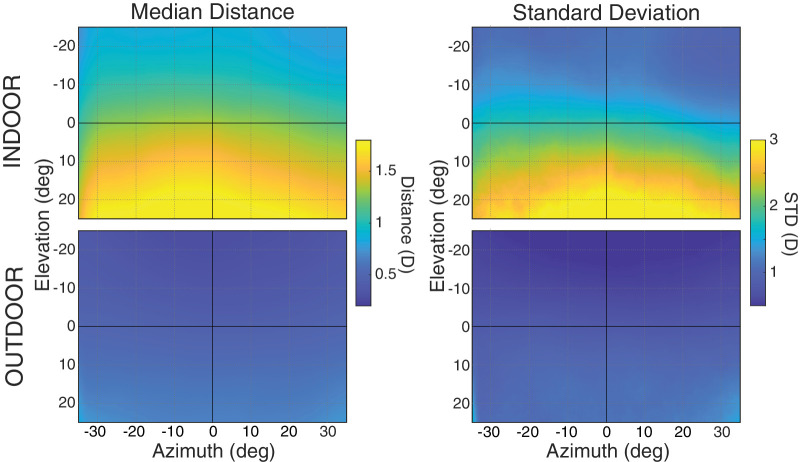
We next compared the distance data from indoor activities with those from outdoor activities. Figure 10 shows the medians and standard deviations plotted in the same format as Figure 9. Figure 10 makes very clear that indoor activities are associated with shorter distances than outdoor activities. They differ by approximately 1 D, especially in the lower field. In addition, indoor environments have noticeably more variance in distances expressed in diopters. Our data are quite similar to ones reported by Flitcroft48 in a computer simulation of indoor and outdoor environments.
Figure 10.
Distance statistics from indoor and outdoor environments. The left panels plot median distance in diopters. The right panels plot standard deviations of those distances. The plots are in head-centric coordinates, so the middle of each panel represents a point in the head's mid-sagittal plane and 18 degrees downward relative to the head's transverse plane. The data were collected from two children as they engaged in various indoor and outdoor activities. The upper panels are the data from 14 indoor activities and the lower panels the data from 2 outdoor activities.
These data show that our device is able to collect and record meaningful data on the distances of points in front of a child as they engage in everyday indoor and outdoor activities.
Discussion and Conclusions
We designed, built, and tested a head-mounted, child-friendly mobile device that enables measurements of the intensity and spectral content of illumination as well as the distances in the visual scene across a wide field of view. It does so without impairing a child's ability to engage in everyday activities. The device works well in both indoor and outdoor settings and is strong enough to be used with active young children.
We showed that measurements of fixation distance are not greatly improved by including eye tracking, so we decided to not incorporate an eye tracker; this significantly reduced the cost and weight of the device while increasing its usability. We compared illumination measurements at the wrist and head and found that the wrist measurements were greater in intensity and more variable than those at the head. The lower magnitude and variability of the head data are probably due to subjects avoiding directing the head and eyes toward bright light sources.
Most importantly, we showed that the device makes accurate and useful measurements of the illumination and distance statistics encountered by a child as he or she goes about everyday activities. The data our device can collect include temporal variation in illumination and distance, which has been shown to be important in animal studies.49–51
Of course, our device has some potential limitations. Occlusions, particularly at near distances, occur where an object is seen by only one camera. In those cases, we cannot compute distance. We note, however, that the regions in which such occlusions occur are a small fraction of the visual field (see Fig. 6). There are potential privacy concerns due to the images captured by the RGB camera. These can be handled by only using the image data to estimate distances and not storing the images themselves. Finally, it is possible that the device causes a modification of the child's normal behavior, perhaps mostly in indoor usage. This issue is minimized by the fact that the device is lightweight and attached to a standard bicycle helmet which is also lightweight. It would, however, be advantageous to have an even lighter device with a form factor like spectacles. Such a device will hopefully be available within the next few years.
Our device can, of course, be used in other applications. For example, some patients with strabismus (eg, intermittent exotropia) exhibit less control of their strabismus in some environments than in others.52,53 Our device could be used to determine what the most influential properties of those environments are. Another example concerns exposure to blue light. There is evidence that excessive exposure to such light is a risk factor for dry eye and cataract. In addition, that it affects sleep, and may affect the health of the retina.54 Our device could be used to provide more data on the amount of blue light approaching the eyes in different situations.
Comprehensive, longitudinal studies of the environmental factors that put children at risk for developing myopia are sorely needed. Our inexpensive device provides an opportunity to conduct such studies in a large population of young children before they develop myopia. This research would hopefully pinpoint the environmental factors that predict which children will develop myopia and which ones will not.
Supplementary Material
Acknowledgments
The authors thank Yoofi Mensah, Ellie Wang, Shruthi Satheesh, and Ruksaar Mohammed for assistance with data collection. The authors also thank Gabriele Arnulfo and Franco Traversaro for the valuable comments on Shell scripting.
Funded by NIH Research Grant K23EY027851, NSF Research Grant BCS-1734677, the Center for Innovation in Vision and Optics (CIVO) at UC Berkeley, and Meta Reality Labs.
Disclosure: A. Gibaldi, None; E.N. Harb, None; C.F. Wildsoet, None; M.D. Banks, None
References
- 1. Rabin J, Van Sluyters R, Malach R. Emmetropization: a vision-dependent phenomenon. Invest Ophthalmol Vis Sci . 1981; 20: 561–564. [PubMed] [Google Scholar]
- 2. Troilo D, Smith EL 3rd, Nickla DL, et al.. IMI–report on experimental models of emmetropization and myopia. Invest Ophthalmol Vis Sci . 2019; 60: M31–M88. [DOI] [PMC free article] [PubMed] [Google Scholar]
- 3. Fan DS, Lam DSC, Lam RF, et al.. Prevalence, incidence, and progression of myopia of school children in Hong Kong. Invest Ophthalmol Vis Sci . 2004; 45: 1071–1075. [DOI] [PubMed] [Google Scholar]
- 4. Williams KM, Bertelsen G, Cumberland P, et al.. Increasing prevalence of myopia in Europe and the impact of education. Ophthalmology . 2015; 122: 1489–1497. [DOI] [PMC free article] [PubMed] [Google Scholar]
- 5. Morgan IG, Wu PC, Ostrin LA, et al.. IMI risk factors for myopia. Invest Ophthalmol Vis Sci . 2021; 62: 3. [DOI] [PMC free article] [PubMed] [Google Scholar]
- 6. Wallman J, Winawer J. Homeostasis of eye growth and the question of myopia. Neuron . 2004; 43: 447–468. [DOI] [PubMed] [Google Scholar]
- 7. Metlapally S, McBrien NA. The effect of positive lens defocus on ocular growth and emmetropization in the tree shrew. J Vis . 2008; 8: 1.1–12. [DOI] [PubMed] [Google Scholar]
- 8. Ashby RS, Schaeffel F. The effect of bright light on lens compensation in chicks. Invest Ophthalmol Vis Sci . 2010; 51: 5247–5253. [DOI] [PubMed] [Google Scholar]
- 9. Smith EL, Hung L-F, Huang J. Protective effects of high ambient lighting on the development of form-deprivation myopia in rhesus monkeys. Invest Ophthalmol Vis Sci . 2012; 53: 421–428. [DOI] [PMC free article] [PubMed] [Google Scholar]
- 10. Stone RA, Cohen Y, McGlinn AM, et al.. Development of experimental myopia in chicks in a natural environment. Invest Ophthalmol Vis Sci . 2016; 57: 4779–4789. [DOI] [PMC free article] [PubMed] [Google Scholar]
- 11. Biswas S, Muralidharan AR, Betzler BK, et al.. A duration-dependent interaction between high-intensity light and unrestricted vision in the drive for myopia control. Invest Ophthalmol Vis Sci . 2023; 64: 31. [DOI] [PMC free article] [PubMed] [Google Scholar]
- 12. Gawne TJ, Grytz R, Norton TT. How chromatic cues can guide human eye growth to achieve good focus. J Vis . 2021; 21: 11. [DOI] [PMC free article] [PubMed] [Google Scholar]
- 13. Wu X, Gao G, Jin J, et al.. Housing type and myopia: the mediating role of parental myopia. BMC Ophthalmol . 2016; 16: 151. [DOI] [PMC free article] [PubMed] [Google Scholar]
- 14. Alvarez AA, Wildsoet CF. Quantifying light exposure patterns in young adult students. J Mod Opt . 2013; 60: 1200–1208. [DOI] [PMC free article] [PubMed] [Google Scholar]
- 15. Ostrin LA, Sajjadi A, Benoit JS. Objectively measured light exposure during school and summer in children. Optom & Vis Sci . 2018; 95: 332–342. [DOI] [PMC free article] [PubMed] [Google Scholar]
- 16. Rose KA, Morgan IG, Ip J, et al.. Outdoor activity reduces the prevalence of myopia in children. Ophthalmology . 2008; 115: 1279–1285. [DOI] [PubMed] [Google Scholar]
- 17. Wu PC, Chen CT, Lin KK, et al.. Myopia prevention and outdoor light intensity in a school-based cluster randomized trial. Ophthalmology . 2018; 125: 1239–1250. [DOI] [PubMed] [Google Scholar]
- 18. He M, Xiang F, Zeng Y, et al.. Effect of time spent outdoors at school on the development of myopia among children in China: a randomized clinical trial. JAMA . 2015; 314: 1142–1148. [DOI] [PubMed] [Google Scholar]
- 19. Smith EL, Hung L-F, Huang J. Relative peripheral hyperopic defocus alters central refractive development in infant monkeys. Vis Res . 2009; 49: 2386–2392. [DOI] [PMC free article] [PubMed] [Google Scholar]
- 20. Bhandari KR, Shukla D, Mirhajianmoghadam H, Ostrin LA. Objective measures of near viewing and light exposure in schoolchildren during COVID-19. Optom Vis Sci . 2022; 99: 241–252. [DOI] [PMC free article] [PubMed] [Google Scholar]
- 21. Read SA, Collins MJ, Vincent SJ. Light exposure and eye growth in childhood. Invest Ophthalmol Vis Sci . 2015; 56: 6779–6787. [DOI] [PubMed] [Google Scholar]
- 22. Ostrin LA, Read SA, Vincent SJ, Collins MJ. Sleep in myopic and non-myopic children. Transl Vis Sci & Technol . 2020; 9: 22. [DOI] [PMC free article] [PubMed] [Google Scholar]
- 23. Verkicharla PK, Ramamurthy D, Duc Nguyen Q, et al.. Development of the FitSight fitness tracker to increase time outdoors to prevent myopia. Transl Vis Sci Technol . 2017; 6: 20. [DOI] [PMC free article] [PubMed] [Google Scholar]
- 24. Li M, Lanca C, Tan CS, et al.. Association of time outdoors and patterns of light exposure with myopia in children. Br J Ophthalmol . 2023; 107: 133–139. [DOI] [PubMed] [Google Scholar]
- 25. Howell CM, McCullough SJ, Doyle L, Murphy MH, Saunders KJ. Reliability and validity of the Actiwatch and Clouclip for measuring illumination in real-world conditions. Ophthalmic Physiol Opt . 2021; 41: 1048–1059. [DOI] [PubMed] [Google Scholar]
- 26. Bhandari KR, Ostrin LA. Validation of the Clouclip and utility in measuring viewing distance in adults. Ophthalmic Physiol Opt . 2020; 40: 801–814. [DOI] [PMC free article] [PubMed] [Google Scholar]
- 27. Dharani R, Lee C-F, Theng ZX, et al.. Comparison of measurements of time outdoors and light levels as risk factors for myopia in young Singapore children. Eye . 2012; 26: 911–918. [DOI] [PMC free article] [PubMed] [Google Scholar]
- 28. Schmid KL, Leyden K, Chiu YH, et al.. Assessment of daily light and ultraviolet exposure in young adults. Optom Vis Sci . 2013; 90: 148–155. [DOI] [PubMed] [Google Scholar]
- 29. Wen L, Cheng Q, Lan W, et al.. An objective comparison of light intensity and near-visual tasks between rural and urban school children in China by a wearable device Clouclip. Transl Vis Sci Technol . 2019; 8: 15. [DOI] [PMC free article] [PubMed] [Google Scholar]
- 30. Cao Y, Lan W, Wen L, et al.. An effectiveness study of a wearable device (Clouclip) intervention in unhealthy visual behaviors among school-age children: a pilot study. Medicine (Baltimore) . 2020; 99: e17992. [DOI] [PMC free article] [PubMed] [Google Scholar]
- 31. Williams R, Bakshi S, Ostrin EJ, Ostrin LA. Continuous objective assessment of near work. Sci Rep . 2019; 9: 6901. [DOI] [PMC free article] [PubMed] [Google Scholar]
- 32. Mrochen M, Zakharov P, Tabakcι BN, Tanrιverdi C, Flitcroft DI. Visual lifestyle of myopic children assessed with ai-powered wearable monitoring. Invest Ophthalmol Vis Sci . 2020; 61: 82. [Google Scholar]
- 33. García MG, Ohlendorf A, Schaeffel F, Wahl S. Dioptric defocus maps across the visual field for different indoor environments. Biomed Opt Express . 2018; 9: 347–359. [DOI] [PMC free article] [PubMed] [Google Scholar]
- 34. Read SA, Alonso-Caneiro D, Hoseini-Yazdi H, et al.. Objective measures of gaze behaviors and the visual environment during near-work tasks in young adult myopes and emmetropes. Transl Vis Sci Technol . 2023; 12: 18. [DOI] [PMC free article] [PubMed] [Google Scholar]
- 35. Kassner M, Patera W, Bulling A. Pupil: an open source platform for pervasive eye tracking and mobile gaze-based interaction. In Proceedings of the 2014 ACM International Joint Conference on Pervasive and Ubiquitous Computing: Adjunct Publication, 2014;1151–1160. Available at: https://dl.acm.org/doi/10.1145/2638728.2641695#:∼:text=In%20this%20paper%20we%20present%20Pupil%20–%20an.
- 36. Sprague WW, Cooper EA, Tošić I, Banks MS. Stereopsis is adaptive for the natural environment. Sci Adv . 2015; 1(1): 17. [DOI] [PMC free article] [PubMed] [Google Scholar]
- 37. Gibaldi A, Banks MS. Binocular eye movements are adapted to the natural environment. J Neurosci . 2019; 39: 2877–2888. [DOI] [PMC free article] [PubMed] [Google Scholar]
- 38. DuTell V, Gibaldi A, Focarelli G, Olshausen B, Banks MS. Integrating high fidelity eye, head and world tracking in a wearable device. In ACM Symposium on Eye Tracking Research & Applications, 2021;1–4.
- 39. DuTell V, Gibaldi A, Focarelli G, Olshausen BA, Banks MS. High-fidelity eye, head, body, and world tracking with a wearable device. Behav Res Methods . 2024; 56: 32–42. [DOI] [PMC free article] [PubMed] [Google Scholar]
- 40. Grunnet-Jepsen A, Sweetser J, Khuong T, et al. Intel Realsense self-calibration for d400 series depth cameras. Tech. Rep., Denver, CO, USA: Intel Corporation; 2021. [Google Scholar]
- 41. Gibaldi A, DuTell V, Banks MS. Solving parallax error for 3D eye tracking. In Conference: ETRA ’21: ACM Symposium on Eye Tracking Research & Applications. 2021;1–4.
- 42. Kothari R, Yang Z, Kanan C, Bailey R, Pelz JB, Diaz GJ. Gaze-in-wild: a dataset for studying eye and head coordination in everyday activities. Sci Rep . 2020; 10: 2539. [DOI] [PMC free article] [PubMed] [Google Scholar]
- 43. Duchowski AT, House DH, Gestring J, et al.. Comparing estimated gaze depth in virtual and physical environments. In Proceedings of the Symposium on Eye Tracking Research & Applications, 2014;103–110.
- 44. Aizenman AM, Koulieris GA, Gibaldi A, Sehgal V, Levi DM, Banks MS. The statistics of eye movements and binocular disparities during VR gaming: implications for headset design. ACM TransGraph . 2023; 42: 7. [DOI] [PMC free article] [PubMed] [Google Scholar]
- 45. Read SA, Collins MJ, Vincent SJ. Light exposure and physical activity in myopic and emmetropic children. Optom Vis Sci . 2014; 91: 330–341. [DOI] [PubMed] [Google Scholar]
- 46. Ostrin LA. Objectively measured light exposure in emmetropic and myopic adults. Optom Vis Sci . 2017; 94: 229–238. [DOI] [PubMed] [Google Scholar]
- 47. Landis EG, Yang V, Brown DM, Pardue MT, Read SA. Dim light exposure and myopia in children. Invest Ophthalmol Vis Sci . 2018; 59: 4804–4811. [DOI] [PMC free article] [PubMed] [Google Scholar]
- 48. Flitcroft D. The complex interactions of retinal, optical and environmental factors in myopia aetiology. Prog Retin Eye Res . 2012; 31: 622–660. [DOI] [PubMed] [Google Scholar]
- 49. Backhouse S, Collins AV, Phillips JR. Influence of periodic vs continuous daily bright light exposure on development of experimental myopia in the chick. Ophthalmic Physiol Opt . 2013; 33: 563–572. [DOI] [PubMed] [Google Scholar]
- 50. Lan W, Feldkaemper M, Schaeffel F. Intermittent episodes of bright light suppress myopia in the chicken more than continuous bright light. PLoS One . 2014; 9: e110906. [DOI] [PMC free article] [PubMed] [Google Scholar]
- 51. Nickla DL, Totonelly K. Brief light exposure at night disrupts the circadian rhythms in eye growth and choroidal thickness in chicks. Exp Eye Res . 2016; 146: 189–195. [DOI] [PMC free article] [PubMed] [Google Scholar]
- 52. Kushner BJ. The distance angle to target in surgery for intermittent exotropia. Arch Ophthalmol . 1998; 116: 189–194. [DOI] [PubMed] [Google Scholar]
- 53. Brodsky MC. The riddle of intermittent exotropia. Invest Ophthalmol Vis Sci . 2017; 58: 4056. [DOI] [PubMed] [Google Scholar]
- 54. Lawrenson JG, Hull CC, Downie LE. The effect of blue-light blocking spectacle lenses on visual performance, macular health and the sleep-wake cycle: a systematic review of the literature. Ophthalmic Physiol Opt . 2017; 37: 644–654. [DOI] [PubMed] [Google Scholar]
Associated Data
This section collects any data citations, data availability statements, or supplementary materials included in this article.


