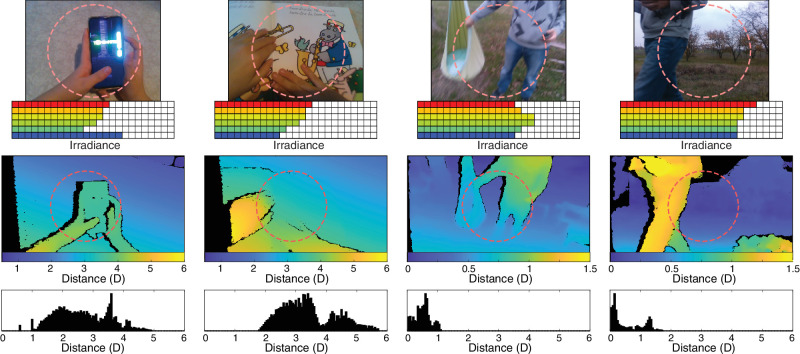
Figure 6.
Example data from our device. The two left columns are data from indoor activities and the two right columns data from outdoor activities. The top row shows images from the RGB camera, which has a field of view of 69 degrees × 42 degrees. The dashed circles represent the field of view of the spectral sensor. We do not store RGB images from actual experimental sessions to avoid privacy issues; they are shown here only as examples. The second row shows irradiances from the above scenes from the six channels of the spectral sensor. The third row shows distances in diopters from the scenes above measured by the depth camera. Blue represents farther points and yellow nearer ones. Note the change in scale between the indoor activities on the left and outdoor activities on the right. Black regions in these panels represent areas where distance computation was not reliable due to occlusions or reflections. The field of view of the depth camera was 87 degrees × 58 degrees, which is somewhat larger than that of the RGB camera. The dashed circles again represent the field of view of the spectral sensor. The bottom row provides distance histograms for the scenes above, where distance is again expressed in diopters.

