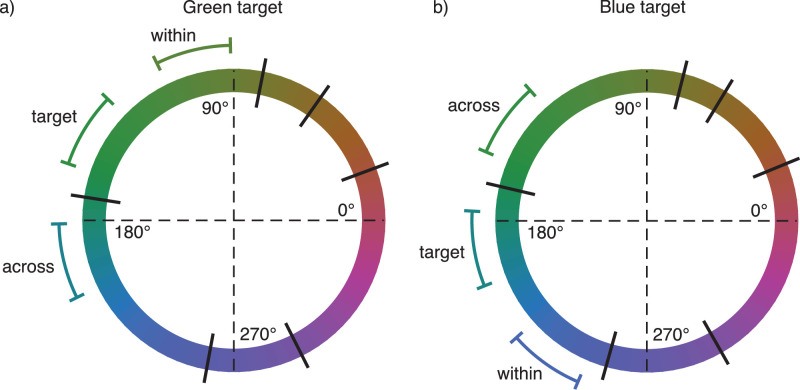
Figure 8.
Average stimulus ensemble hue distributions in Experiment 2 displayed against a hue circle in CIELUV color space (a) for the green target and (b) for the blue target. Black lines orthogonal to the hue circle show average color category boundaries across observers. Curves tangential to the hue circle show the range of different ensemble hue distributions, not including trial-to-trial jitter.

