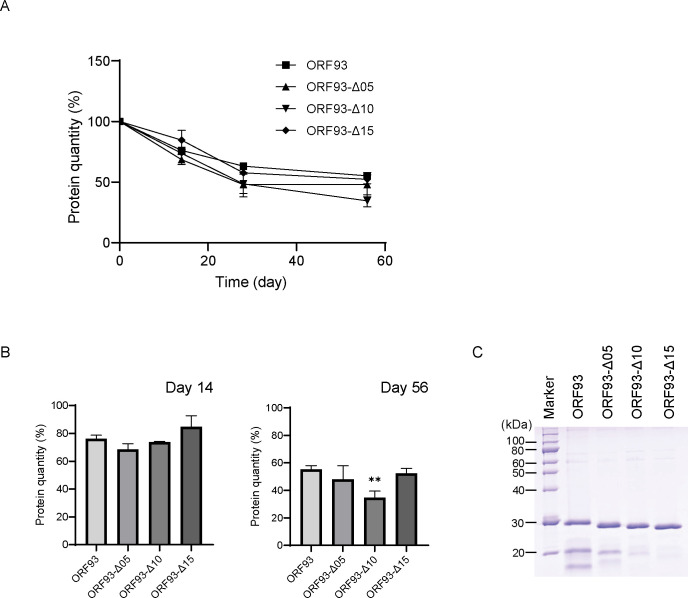
Fig 4. Cold storage of ORF93 and its mutants.
Error bars indicate SD (n = 3). (A) Protein quantity changes over time. The protein quantity is presented as a relative rate, which at the first day was set to be 100%. (B) The protein quantity of the endolysin solution on day 14 and day 56. We compared protein quantity of ORF93 with those of linker deletion mutants on days 14 and 56. Statistical significance is shown on the graph with a double asterisk (**, P < 0.01). (C) SDS-PAGE image. We analyzed 10 μL of endolysin solutions by SDS-PAGE together with a protein marker (5 μL of XL-Ladder Broad protein molecular weight, APRO Life Science Institute) on day 56.

