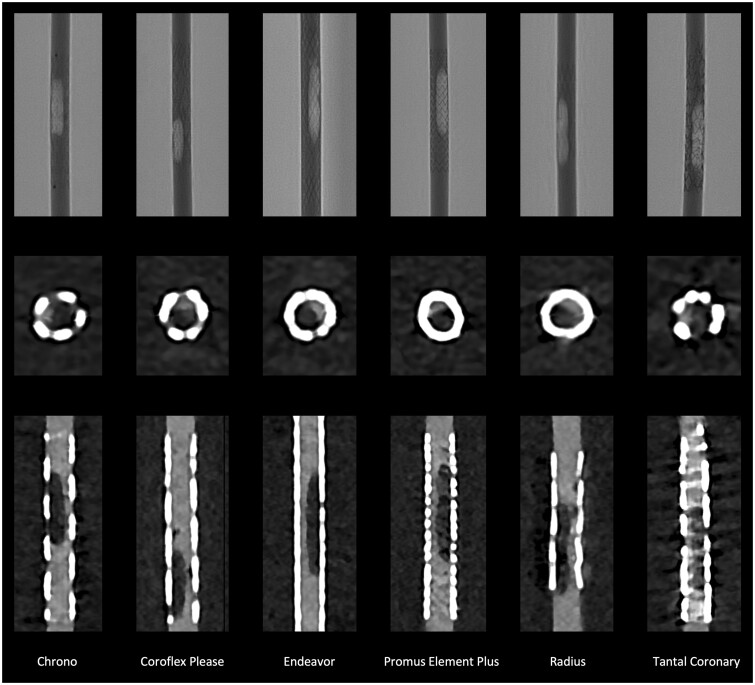
Figure 2.
Angiography and PCCT of in-stent stenosis. The first row shows the angiographic image of the stents with the stenoses in optimal projection for each stent used. The second row shows the axial reconstruction, the third the corresponding longitudinal reconstruction of the CCTA. CT images reconstructed with UHR data sets and the optimized Bv72 kernel. Abbreviations: PCCT = photon counting CT; UHR = ultra-high-resolution mode.

