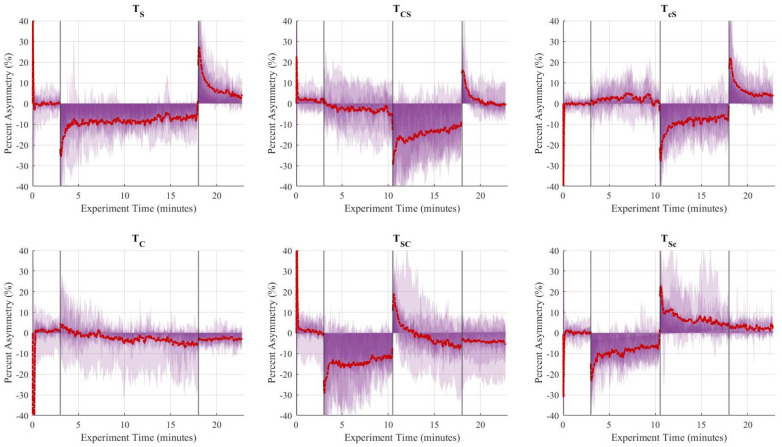
Figure 5.
Aggregate (n = 10) step length asymmetry (%) over time for the six trials. The vertical lines separate the experimental stages: baseline (3 min), adaptation-1 (7.5 min), adaptation-2 (7.5 min), and post-adaptation (5 min). The single asymmetric interventions were applied continuously during the 15-minute adaptation period. The red dashed line represents the group's average asymmetry throughout the experiments, and the translucent purple areas are indicative of the gait asymmetry of each individual throughout the experiment.

