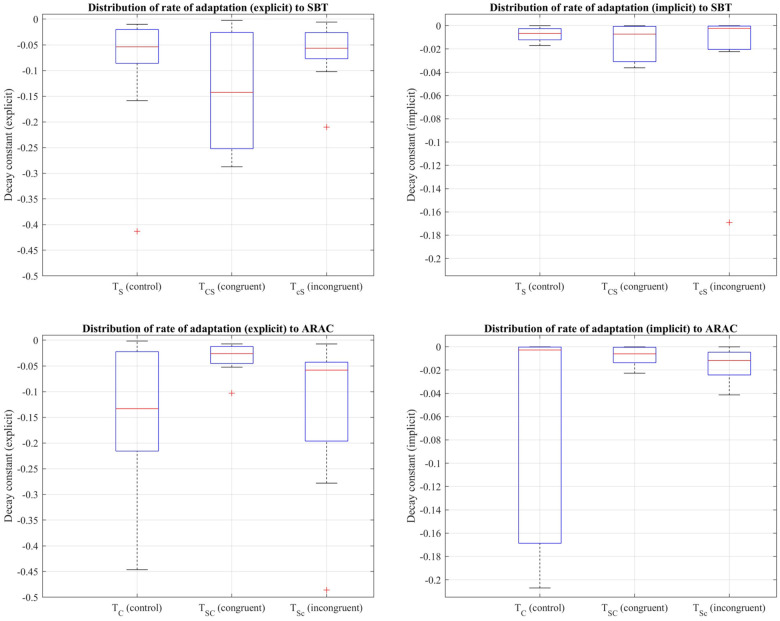
Figure 6.
Distribution of decay constants depicting the explicit (left column) and implicit (right column) components of the adaptation rate of step length asymmetry (%) to SBT (top row) and ARAC (bottom row) during the first half of the adaptation period of , , and adaptation-2 for the sequential combination trials demonstrated using a box-and-whisker plot. The box outlined in blue shows the interquartile range, the red horizontal line indicates the median of the distribution, and the outliers are shown using the red “+” symbols.

