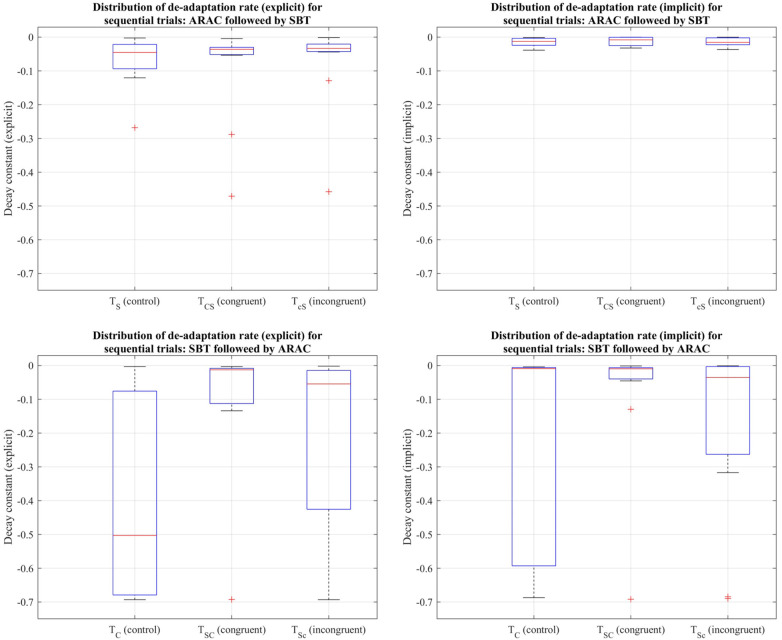
Figure 7.
Distribution of decay constants depicting the explicit (left column) and implicit (right column) components of de-adaptation between the six trial types for step length asymmetry demonstrated using a box-and-whisker plot. The top row demonstrates distribution of de-adaptation rate from SBT and trials in which ARAC is followed by SBT; the bottom row demonstrates distribution of de-adaptation rate from ARAC and trials in which SBT is followed by ARAC. The box outlined in blue shows the interquartile range, the red horizontal line indicates the median of the distribution, and the outliers are shown using the red “+” symbols.

