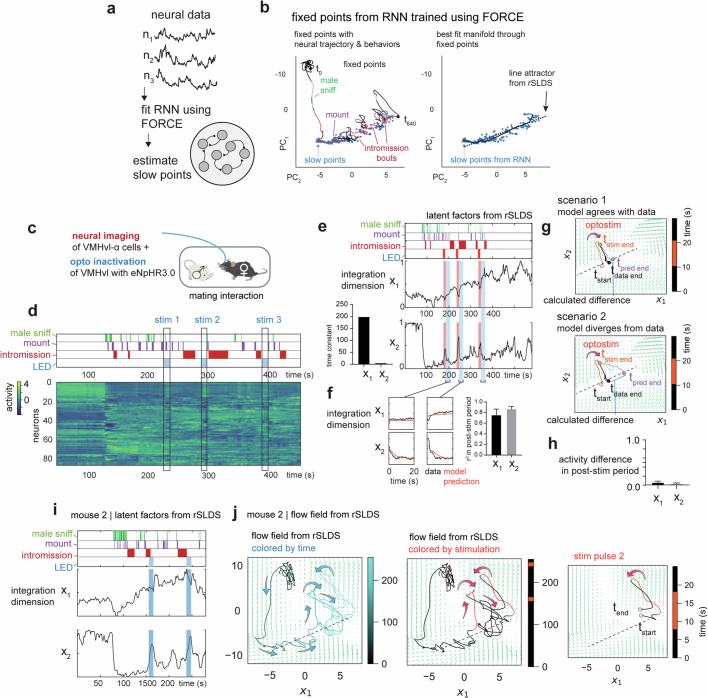
Extended Data Fig. 5. Independent verification and neural perturbations of line attractor dynamics.
a, Cartoon illustrating approach of fitting RNNs to neural data using FORCE. b, Slow points and attractor manifold uncovered by FORCE, overlaid with line attractor uncovered by rSLDS. c, Paradigm for simultaneous neural perturbation & imaging during a mating interaction in females. GcaMP was expressed in VMHvl-α cells while halorhodopsin (eNpHR3.0) was expressed in all VMHvl neuron using a pan-neuronal driver. d, Neural data obtained from a female showing annotated male behaviors and optogenetic inhibition (LED). e, Left: Latent factors from two-dimensional rSLDS model fit to neural data. Reproduced for explanatory purposes from Fig. 3h. Right: Time constants of the two longest-lived dimensions from rSLDS model fit to data from unperturbed periods (excluding stimulation period plus a 20 s post-stimulus period). f, Left: Performance of model on held out data from 20 s immediate post-stimulus period (taken from highlighted blue portions of graphs in e). g, Cartoon depicting quantification of flow field prediction following optogenetic perturbation. The flow field fit from unperturbed periods of time is used to predict the neural trajectory following perturbation (t-pred end, purple line). This trajectory is then compared to data (t-data end, black line). Scenario 1 illustrates when the model agrees with data, resulting in a low difference in activity along the line attractor (top). Scenario 2 illustrates when the model diverges from data resulting in a large deviation in final position along the line attractor (bottom). h, Quantification of flow field prediction following perturbation as the difference in activity level at the end of the 20 s post-stimulus period between data and model in both x1 and x2 dimensions across mice (activity difference for x1: 0.05 ± 0.03, for x2: 0.03 ± 0.01, n = 3 mice). i, Latent factors from rSLDS of mouse 2 during neural perturbation. j, Flow field and neural trajectories for mouse 2. Note that trajectories are pushed away from the attractor during stimulation and then return to line attractor following stimulation offset, as predicted by the flow field.

