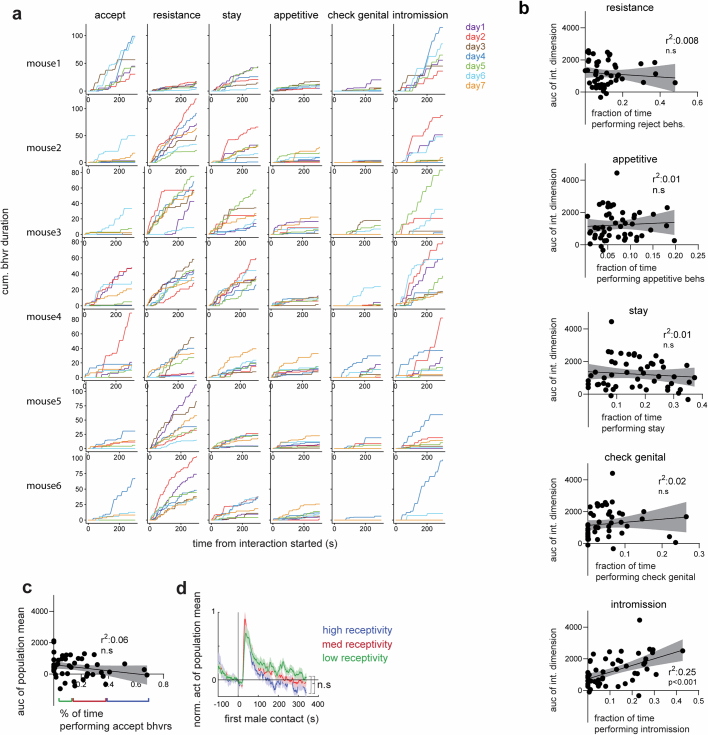
Extended Data Fig. 10. Longitudinal mating assay and correlation with attractor dynamics.
a, Behaviors displayed in mating interactions across days from all the recorded females. b, The scatter plots of the integration dimension values and the amount of female resistance behaviors (linear regression, R2 = 0.008), appetitive behaviors (R2 = 0.01), staying (R2 = 0.01), checking genital (R2 = 0.02) and male intromission (R2 = 0.25). Data presented as mean ± SEM. c, correlation of area under the curve (auc) of the population mean of all neurons with the percentage of time spent performing accepting behaviors. Data presented as mean ± SEM. d: activity of population mean from trials with varying degrees of receptivity defined in a). Data presented as mean ± SEM, Mann-Whitney U test.

