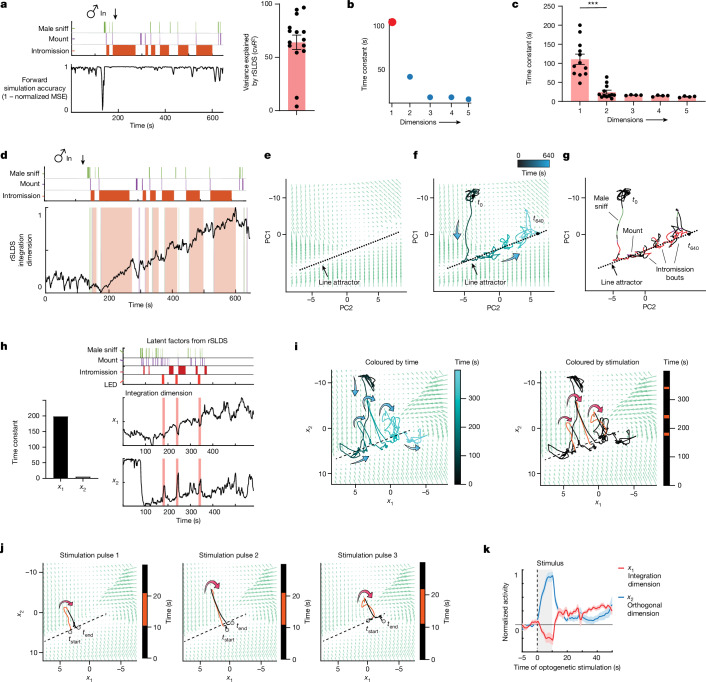
Fig. 3. An approximate line attractor in female VMHvl during mating.
a, rSLDS model performance measured by forward simulation accuracy (calculated as (1 − normalized mean squared error (MSE))21 in an example mouse (left), and variance explained by a rSLDS model fit without an input term (Methods) for all mice (right; n = 15 mice, mean = 64.08%). The variance explained by the two outliers can be increased by incorporating an input term. b, Time constants reveal a single dimension with a large time constant. c, Distribution of time constants across animals fit by the rSLDS. Time constants are sorted by magnitude in each animal (***P < 0.001; n = 15 mice; mean time constant of dimension 1: 110.7 ± 13.6 and dimension 2: 24.5 ± 5.1; P = 6.5 × 10⁻⁵). d, Dynamics of the integration dimension reveals a ramping dimension, aligned to male mating behaviours in an example trial. Variance explained of 73.7%. e, Flow field of VMHvl α-cell dynamical system. PC1 principal component 1. f, Flow field of VMHvl α-cell dynamical system showing neural trajectories in state space. t0, time 0 s. g, Neural state space of VMHvl α-cell dynamical system and behaviours, highlighting regions where fixed points are present (dashed line). h, Time constants of latent factors from the rSLDS model (left), and projection of rSLDS latent factor activity from the rSLDS model trained on neural data from unperturbed periods (right; that is, excluding LED stimulation and 20-s post-stimulation interval). i, Flow field and neural trajectories from the rSLDS model coloured by time (left), and neural trajectory coloured by stimulation periods (right). j, Flow field and neural trajectories for each of the three stimulation periods for mouse 1. Note that trajectories are pushed away from the attractor during stimulation and then return to the line attractor following stimulation offset, as predicted by the flow field. This approach also tests the validity of the extrapolated regions of the flow field uncovered by the rSLDS. k, Stimulus-triggered average of response in integration dimension (x1) and orthogonal dimension (x2) upon optogenetic stimulation. n = 3 mice. The dotted vertical line indicates the onset of the stimulus, and the shaded area represents the duration of the stimulus. The horizontal line indicates the pre-stimulus baseline of normalized activity.

