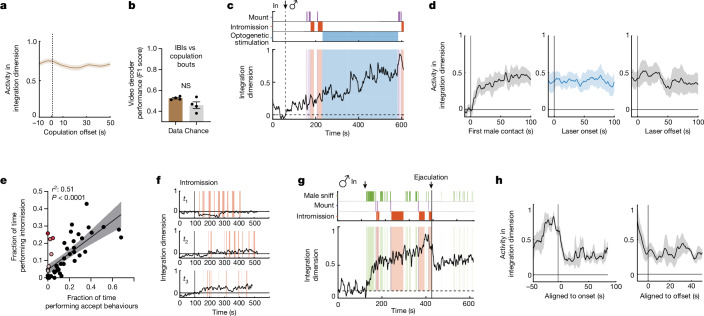
Fig. 4. A line attractor encodes a persistent and ramping state during mating.
a, Behaviour-triggered average of the normalized activity of the integration dimension aligned to the offset of male copulation. Dashed line represents offset of copulation events. Data are presented as mean ± s.e.m. b, Videoframe behavioural decoder performance trained on neural data from copulation bouts versus IBIs (n = 4 mice, P = 0.2, Mann–Whitney U-test, mean value of data of 0.52 ± 0.007, shuffle of 0.49 ± 0.03). c, Dynamics of the integration dimension in an example female combined with optogenetic inhibition of mating behaviours in the interacting male. d, Behaviour-triggered average of the normalized activity of the integration dimension aligned to first male contact (left), optogenetic mating inhibition onset (middle) and inhibition offset (right; n = 4 mice). Data are presented as mean ± s.e.m. e, Scatter plots of time spent by males performing intromission and time spent by females performing acceptance behaviours to identify trials with high intromission and low receptivity (coloured dots). Data are presented as mean ± s.e.m. P = 7.09 × 10⁻¹². f, Example traces of the integration dimension for trials with intromission but low receptivity (identified from panel e). g, Dynamics of the integration dimension, aligned to male mating behaviours in an example trial with ejaculation. h, Behaviour-triggered average of the normalized activity of the integration dimension aligned to the ejaculation onset and offset (n = 4 mice). Data are presented as mean ± s.e.m. Dashed line indicates the onset or offset of ejaculation.

