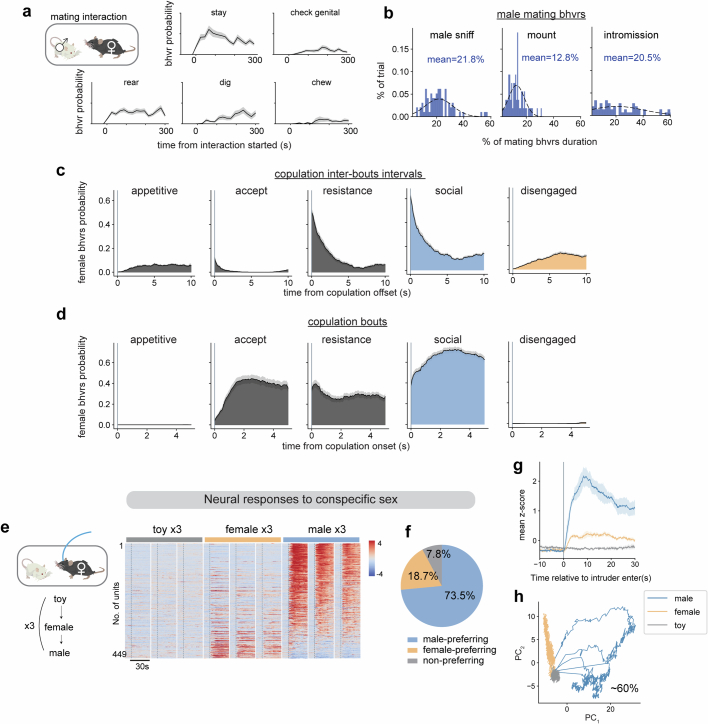
Extended Data Fig. 1. Behavior dynamics and neural responses to conspecific sex.
a, The probability of female behaviors every 20 s (n = 74 trials, N = 28 mice). b, Distribution of the percentage of time males displayed mating behaviors in each trial (n = 74 trials). c, The probability of female behaviors aligned to male copulation offsets and d, copulation onsets. (e-h), Neural responses to conspecific sex. e, Left, diagram of sex representation test. Each intruder was presented for 1 min. Right, concatenated average responses to toy, female, or male (N = 8 mice). Color scale indicates z-scored activity. Units were sorted by temporal correlation. f, Percentages of male- or female-preferring cells (calculated by Choice Probability). g, Mean responses of female VMHvlEsr1 α cells to male, female and toy (N = 8 mice). Data presented as mean ± SEM. h, PCA of neuronal responses to male, female and toy from one example female.

