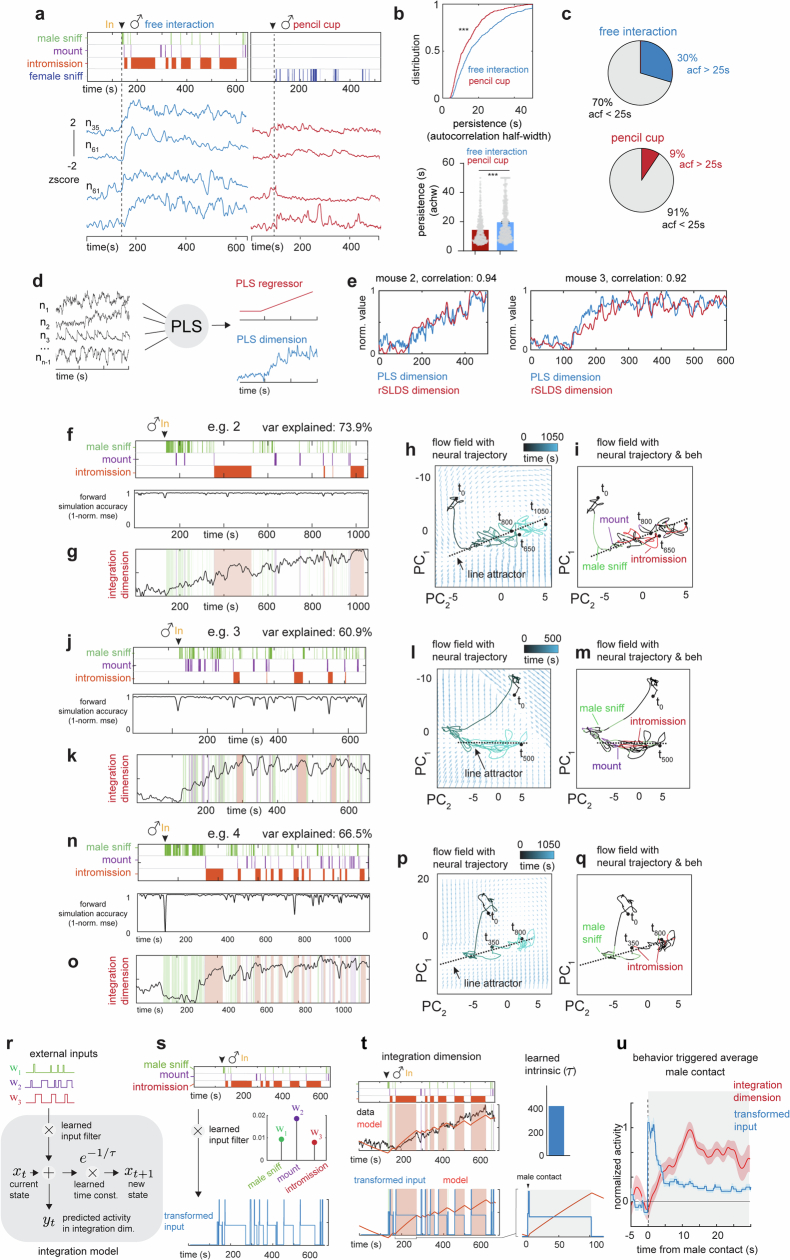
Extended Data Fig. 3. Additional example trials with rSLDS model fit, additional information for Fig. 3.
a, Dynamics of persistently active neurons identified during receptive interaction with pencil-cup assay. b, Cumulative distribution & bar plot of ACHW for same neurons during free interaction vs pencil cup assay ****p < 0.0001, Mann-Whitney U test, p value: 1.25e-11, N = 470 neurons from 5 mice. mean ACHW during pencil cup: 14.3 ± 0.42, free interaction: 19.6 ± 0.58. c, Pie chart indicating fraction of neurons with ACHW > 25 s in free interaction and in pencil cup assay. d, Schematic illustrating partial least squares regression to extract integration dynamics in VMHvl. e, Comparison of rSLDS integration dimension and PLS dimension for two example mice showing a high correlation. (f-q), Additional example trials with rSLDS model fit. f, Recurrent switching linear dynamical systems (rSLDS) model fit forward simulation accuracy aligned to male behaviors in example trial 2. g, Dynamics of the integration dimension in trial 2. h, Flow field of VMHvl α dynamical system showing neural trajectories in state space, annotated by time from male encounter (t0) for trial 2. i, Neural state space of VMHvl α dynamical system highlighting behaviors and the region containing the line attractor for trial 2. j-m, the same as g-i for example trial 3. n-q, the same as j-i for example trial 4. r, Integration model used to dissect the contribution of intrinsic decay and external inputs (male behaviors; male-sniff, mount, and intromission). A single state LDS model is used to fit external inputs to predict activity in the integration dimension. s, Top: External inputs to integration model, middle: learned input filter showing weights that are multiplied with the external inputs. Bottom: transformed input obtained by multiplying external inputs with input filter. t, Top: Data and model prediction from LDS to predict activity in the integration dimension. The learned model has a large intrinsic time constant (right). Bottom: Transformed input (weighted input from three male behaviors) and model prediction overlayed with behaviors. u, Behavior triggered average of transformed input and integration dimension aligned to male contact. Male contact is present for the duration of the shaded region. Data presented as mean ± SEM.

