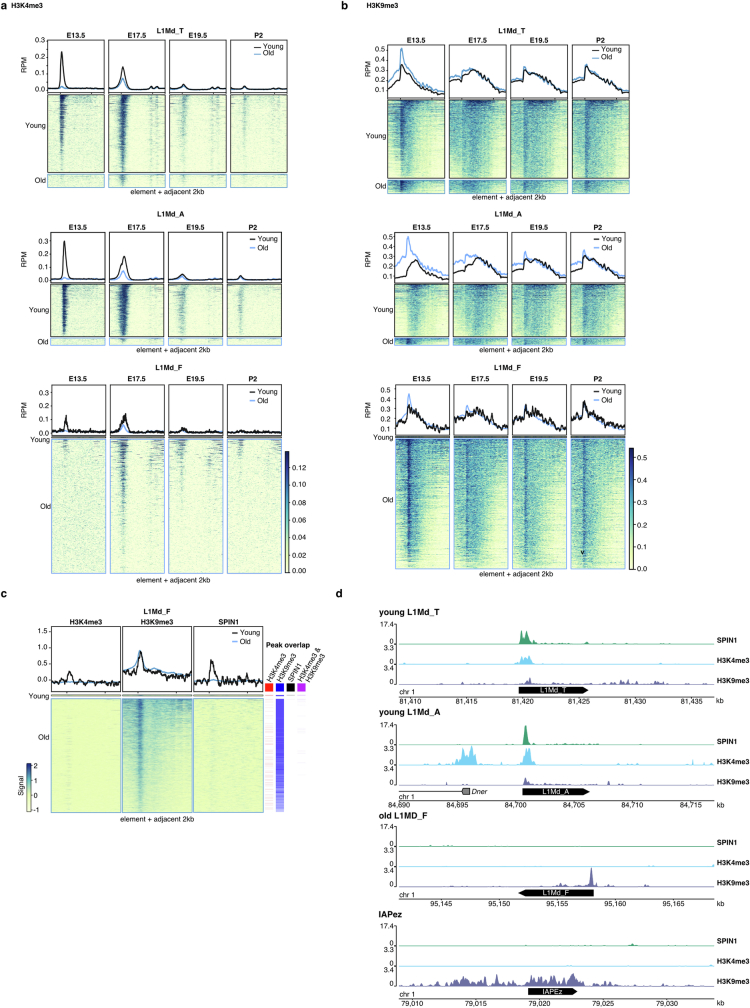
Extended Data Fig. 3. H3K4me3, H3K9me3 and SPIN1 mark young LINE1 elements prior to de novo genome methylation.
Metaplot and heat maps of H3K4me3 (a) and H3K9me3 (b) ChIP from foetal gonocytes at the indicated timepoints during mouse development. Data is merged from two biological replicates, reanalysed from24. a-b, Panels show H3K4me3 (a) and H3K9me3 (b) ChIP-seq signal in reads per million (RPM) over young and old elements within the indicated LINE1 family. c, Metaplot and heat maps of indicated CUT&Tag signal of H3K4me3, H3K9me3 and SPIN1 over young and old L1MD_F elements. Columns adjacent to the heatmaps show peaks called for SPIN1 and the indicated histone modifications. Data is merged from two (H3K4me3, H3K9me3) and three (SPIN1) biological replicates. a-c, Data depicts element plus adjacent 2 kb for each of the transposon families indicated. d, Genome snapshots showing datatracks of CUT&Tag signal of H3K4me3, H3K9me3 and SPIN1 over selected genome regions containing a young L1Md_A, young L1Md_T, old L1Md_F or IAPEz element. Data is merged from two (H3K4me3, H3K9me3) and three (SPIN1) biological replicates. Enrichment of overlapping H3K4me3 and H3K9me3 peaks with SPIN1 peaks is not significantly different between young and old L1Md_F copies, as observed by a two-tailed Fisher’s exact test.

