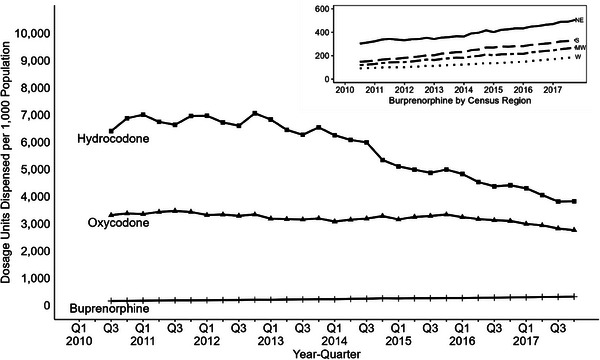
FIGURE 2.

Quarterly dosage units dispensed per capita by drug (2010‒2017). Buprenorphine dispensing per capita remains lower than hydrocodone and oxycodone. However, buprenorphine dispensing per capita rose across all census regions, with dispensing per capita being greatest in the Northeast and lowest in the West. Dispensing data available beginning in 2010Q3; methadone dosage units dispensed not shown due to known underestimate of methadone dispensing in data.
