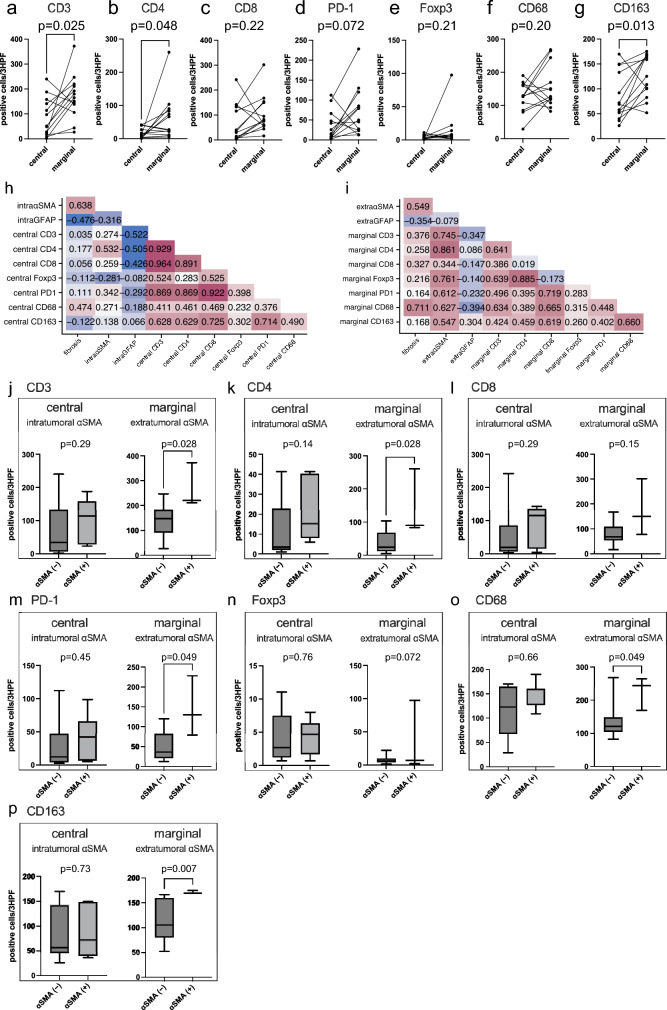
Fig. 5.
Correlation analysis of the number of immune cells depending on area and tumor fibrosis. a–g Comparison between central and marginal areas of CD3-, CD4-, CD8-, PD-1-, Foxp3-, CD68, and CD163-positive immune cells (n = 13). h Correlation matrix of fibrosis and the tumor microenvironment of the central area. i Correlation matrix of fibrosis and the tumor microenvironment of the marginal area. j–p Comparison of numbers of CD3-, CD4-, CD8-, PD-1-, Foxp3-, CD68, and CD163-positive immune cells in negative (n = 6) and positive (n = 7) αSMA scores in the central area of the tumor, as well as negative (n = 10) and positive (n = 3) αSMA scores in the marginal areas

