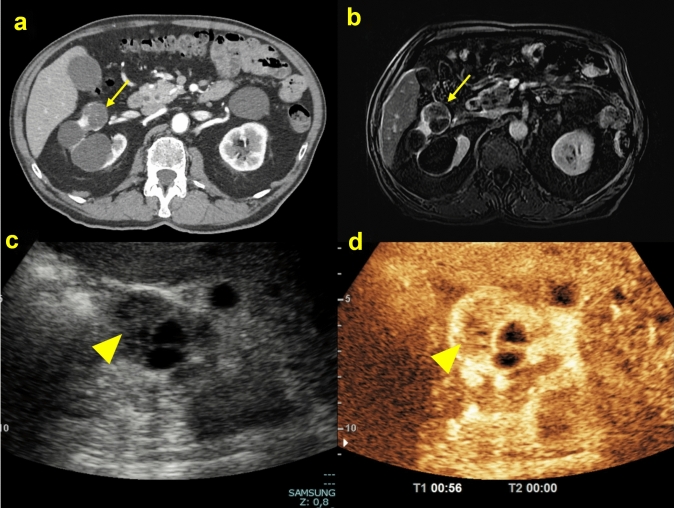
Fig. 9.
(a, b, c, d) Axial CT scan in the arterial phase A showed an inhomogeneous renal cystic lesion (yellow arrow) due to the prevalent cystic component; post-contrast T1-p fat-suppressed sequence in the arterial phase B confirmed the larger liquid component of the renal lesion (yellow arrow); B-mode ultrasound scan C showed a renal lesion with mixed echotexture (yellow arrowhead), with a contextual liquid component; CEUS D showed a solid nodule, with > 25% greater contrast gain. The histological diagnosis was clear cell carcinoma

