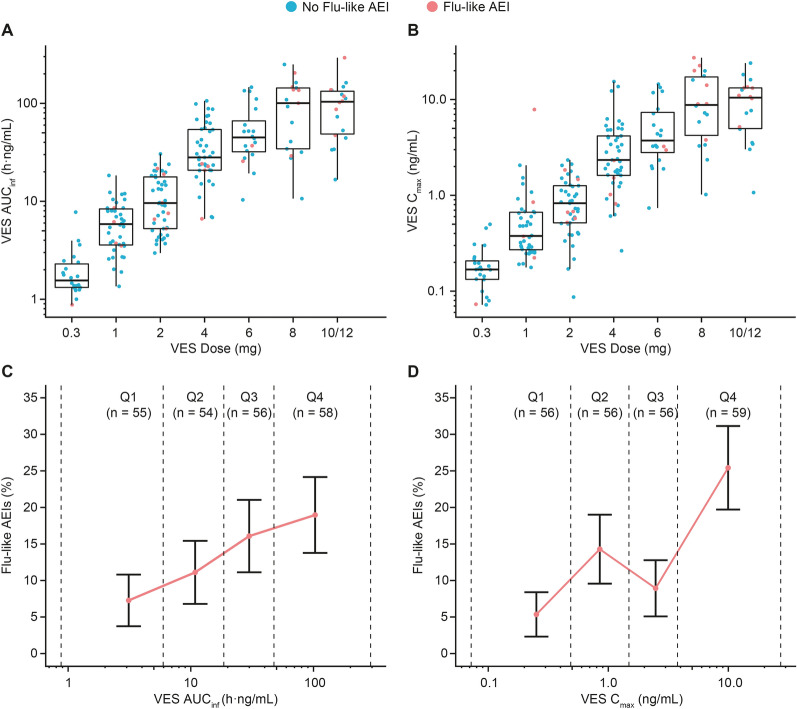
Fig. 2.
Incidence of influenza-like adverse events of interest by vesatolimod exposure. A, B Distribution of VES AUCinf and Cmax by VES dose level administered in fasted state or with empty stomach to participants with pharmacokinetic measurements across eight clinical studies. Dots represent individual data; boxes represent 25th to 75th percentiles; whiskers represent 1.5 times the interquartile range not exceeding the minimum/maximum values. Participants who experienced flu-like AEIs are highlighted in red dots. C, D Percentages of participants with flu-like AEIs are plotted by quartiles of VES AUCinf and Cmax in all participants with pharmacokinetic measurements across eight clinical studies. Error bars represent standard errors. Rates of flu-like AEIs were plotted against mean AUCinf and Cmax in each quartile. In all panels, dashed line indicates range of AUCinf or Cmax within each quartile (Q1, first quartile; Q2, second quartile; Q3, third quartile; Q4, fourth quartile). AUCinf area under the concentration–time curve to infinity after a single dose, Cmax maximal concentration, flu-like AEIs influenza-like adverse events of interest, Q quartile, VES vesatolimod

