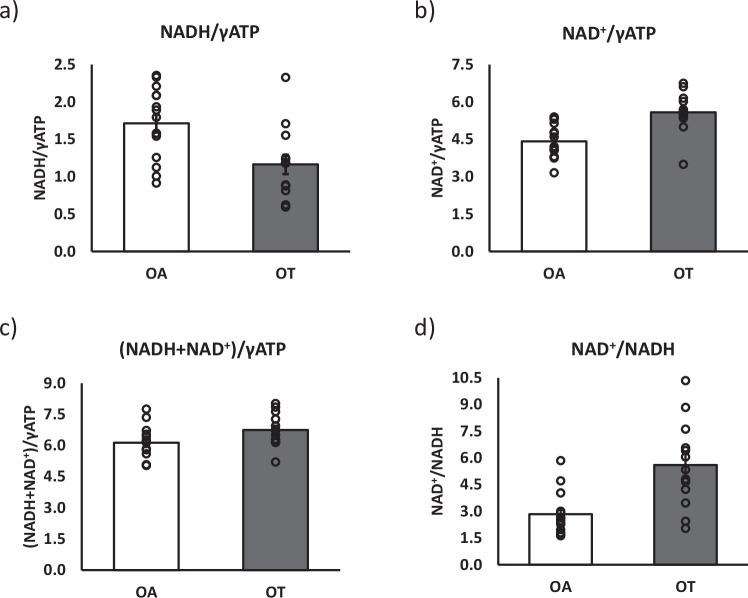
Fig. 5. Comparison of NADH and NAD+ content in normal active versus exercise-trained adults.
To test whether the method can detect differences between volunteers differing in fitness and metabolic health status, NADH and NAD+ content were assessed in normally active and exercise-trained older adults. Here, we show a comparison of NADH content (a), NAD+ content (b), total NAD content (c), and NAD+/NADH ratios (d) in 15 normally active older adults (OA, n = 15) and 13 trained older adults (OT, n = 13). Data are presented as mean values ± SEM. Groups were statistically compared using a two-sided unpaired student t-test. a p = 0.006, b p = 0.0003, c p = 0.001, d p = 0.051. ** p < 0.01, * p < 0.05. Source data are provided as a Source Data file.

