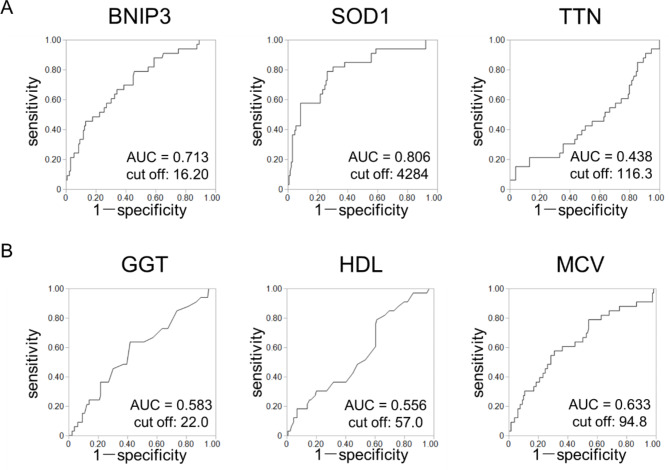
Fig. 5.
Selection of the sensitive indicators of high alcohol consumption at a young age. Indicators were assessed based on the area under curve (AUC) values calculated from receiver operating characteristic (ROC) curves. (A) ROC curves for plasma levels of antioxidant-related genes: BNIP3, SOD1, and TTN. (B) ROC curves for levels of alcohol-related parameters: gamma-glutamyl transferase (GGT), high-density lipoprotein cholesterol (HDL-C), and mean corpuscular volume (MCV). Of these 6 AUC values, the SOD1 level had the highest AUC value of 0.806.

