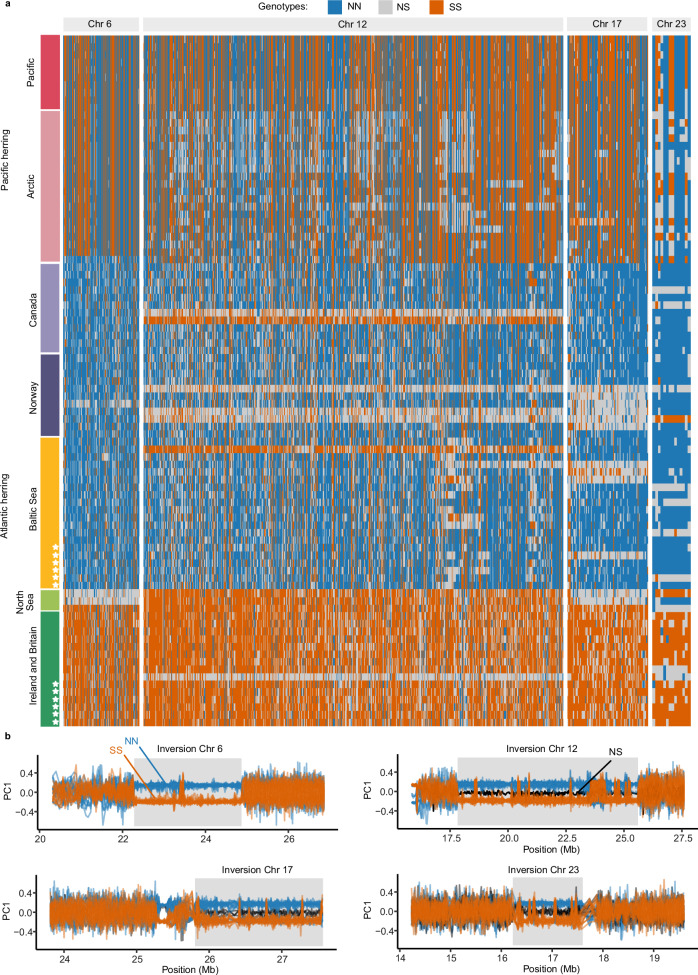
Fig. 1. Individual genotypes at the four inversions.
a Heatmap of genotypes of 91 individuals at highly differentiated SNPs between northern and southern populations of Atlantic herring31 that overlap with the inversions on chromosomes 6, 12, 17, and 23. Each row represents the genotypes of one individual, and each column represents a SNP position. Colored bars represent Atlantic herring or Pacific herring populations. Stars represent individuals from the PacBio sample set. The “Arctic” block includes individuals from the White Sea, Pechora Sea and Balsfjord, the latter a fjord in the North-Atlantic Ocean harboring a Pacific-Atlantic herring hybrid population33. Genotypes are color-coded depending on their homozygosity or heterozygosity for N and S alleles. Genotypes are polarized assuming that the S allele is in high frequency (>0.5) in Ireland and Britain. b Sliding window PCA analysis across inversion regions (sliding windows of 200 SNPs). Each line represents one of 35 individuals from the Baltic and Celtic Sea (dark green and yellow individuals from panel a). Individuals are color-coded according to their genotype at the inversion: blue if homozygous for the N allele, orange if homozygous for the S allele and black if heterozygous.

