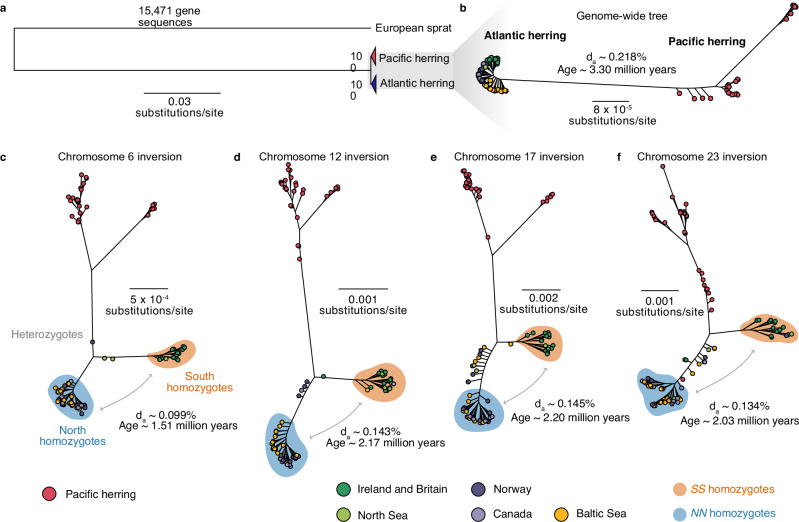
Fig. 5. The evolutionary history of chromosomal rearrangements in Atlantic herring.
a Maximum likelihood tree of 15,471 concatenated gene sequences from 30 Pacific and 61 Atlantic herring, using the European sprat as an outgroup; b Maximum likelihood tree of 345,966,161 bp concatenated genome-wide positions with no missing data using the same 91 individuals; c–f Maximum likelihood trees of the inversion regions (alignments allowing 50% missing data). Estimated net nucleotide divergence (da) and divergence times in million years between Atlantic and Pacific herring (b) and between N and S homozygotes (c–f) are indicated. In trees (b–f), Atlantic herring individuals are color-coded depending on the population of origin.

