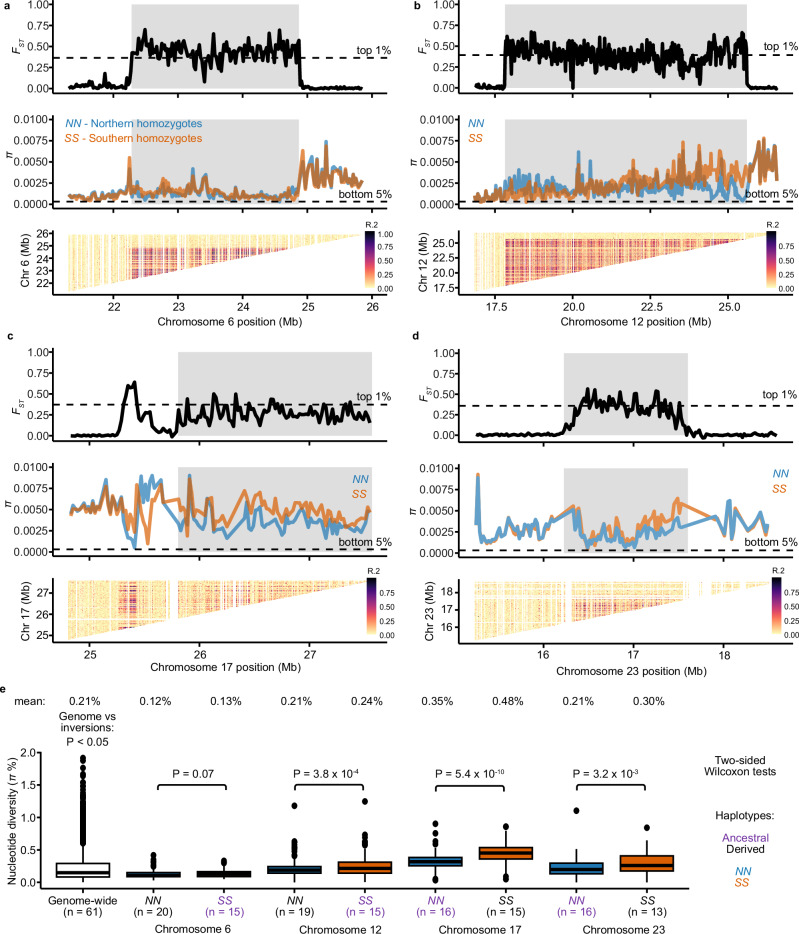
Fig. 6. Differentiation, diversity, and recombination patterns in inversion regions in Atlantic herring on Chr6, Chr12, Chr17, and Chr23.
a Chr6, b Chr12, c Chr17, and d Chr23. Distribution of FST and nucleotide diversity (π) for N and S homozygotes are displayed in sliding windows of 20 kb across inversion regions (shaded gray boxes). Linkage disequilibrium is represented as R2 among genotypes in the inversion region. We thinned SNPs positions to perform this calculation (see “Methods”). e Comparison of the distribution of nucleotide diversity (π) calculated in sliding windows of 20 kb for each inversion haplotype and genome-wide. Sample size is indicated below each boxplot. Nucleotide diversity for each group is displayed above the boxplots, and ancestral alleles are highlighted in purple. Boxplots present the median, 25th and 75th percentiles of the distribution. The results are based on short-read data mapped to the Atlantic herring reference genome.

