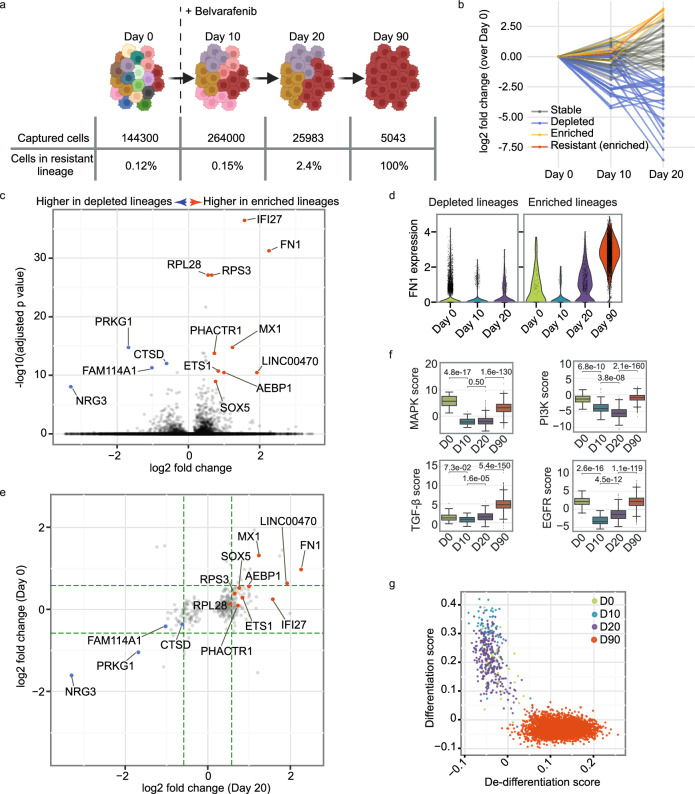
Fig. 3. OAK single-cell lineage tracing and transcriptome profiling for melanoma cells during belvarafenib treatment.
a Diagram of lineage tracing experiment. IPC-298 cells labeled with lineage barcodes were sampled for scRNA-Seq on Days 0, 10, 20, and 90. Belvarafenib treatment commenced following Day 0 subculture collection. Schematic created in BioRender. Darmanis, S. (2023) BioRender.com/l09z998b Fold change in cell count for each lineage at each time point. Cell counts from Day 0 served as the baseline. Enriched (yellow) includes lineages with over tenfold increase from Day 0 to Day 20. Resistant (enriched) refers to the lineage enriched on Day 20 and resistant on Day 90. Stable refers to lineages neither depleted nor enriched. c Volcano plot depicting differentially expressed genes on Day 20 between depleted and enriched lineages. P values are calculated by the Wilcoxon rank-sum method (two-sided) with the benjamini-hochberg correction method. Genes with adjusted p values lower than 1e-8 and log2 fold changes beyond ±0.5 are labeled. d Violin plots for FN1 expression level (normalized and log-transformed) in cells within depleted and enriched lineages. e Fold changes between the depleted and the enriched lineages, with specific genes labeled the same as in (d). Green dashed lines denote ±1.5-fold changes. f PROGENy pathway scores for each cell at Day0 (n = 42), Day 10 (n = 59), Day 20 (n = 275), and Day 90 (n = 4827) within the resistant lineage. P values are calculated using the Mann-Whitney-Wilcoxon test (two-sided) with Bonferroni adjustment. Boxplots’ center lines represent medians. Boxplots: center lines are medians; limits denote Q1 and Q3; whiskers extend to 1.5 times IQR or last data points if within limits. g De-differentiation and differentiation scores for cells within the resistant lineage. Source data are provided as a Source Data file.

