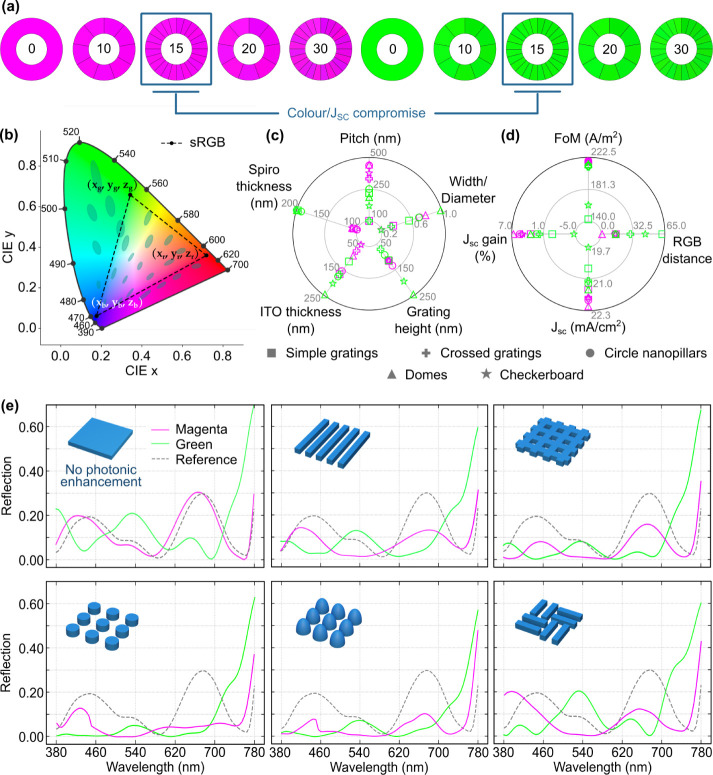
Figure 5.
(a) Chromaticity wheels at an assortment of RGB distances from magenta (255, 0, 255) and green (0, 255, 0) (defined by eq 1), between 0 and 30, indicated at the center of each wheel. (b) 1931 CIE color gamut, with respective wavelengths shown around the outline. The dashed triangle represents the standardized RGB (sRGB) area of the gamut, which was adopted in this work; its vertices (located in the green, red and blue region) are represented as (x,y,z) coordinates. The oval highlights are the MacAdam ellipses—areas where the human eye cannot perceive the different colors (for better visualization, the ellipse sizes are amplified by 10 times). (c) Optimal geometrical parameters of magenta and green solar cells with photonic-enhancing structures: simple gratings, crossed gratings, circle nanopillars, domes and checkerboards (values in Table S3). (d) Figure of merit maxima (as defined by eq 2) attained by particle swarm optimizations and corresponding cell merit quantities: RGB distance (determined by eq 1), JSC and respective gain, relative to the reference cell. The color of the markers corresponds to the cell chromaticity (Table S4). (e) Reflection spectra of the optimal magenta and green solar cells with and without photonic structures, along with the reference spectrum. The colors of the line plots correspond to the cell chromaticities.

