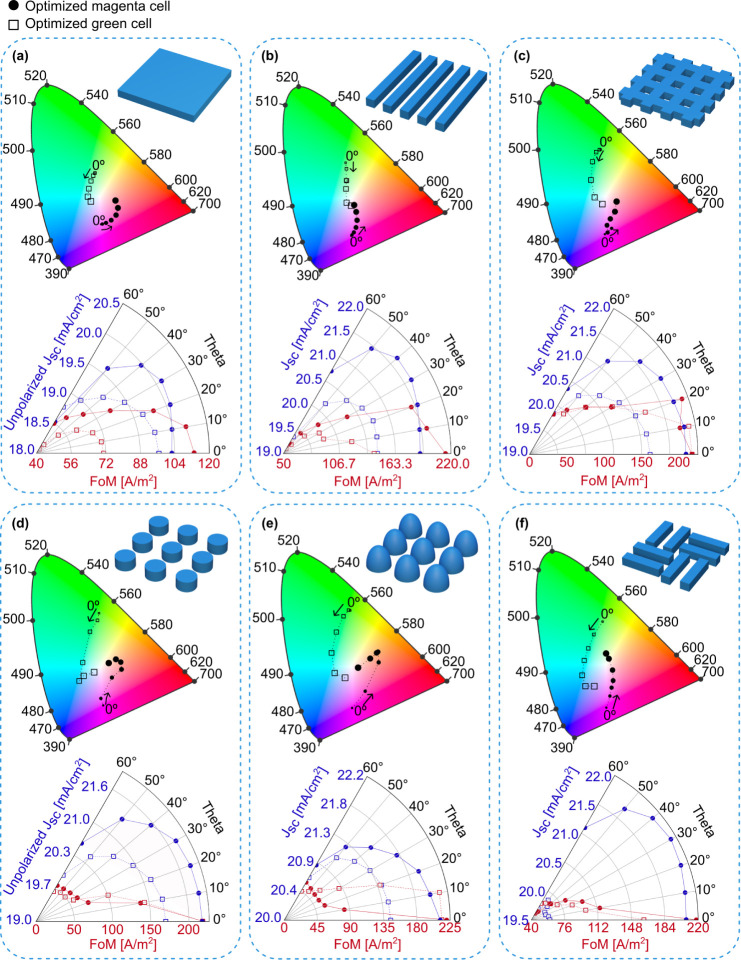
Figure 6.
Solar cell chromaticity (shown in CIE gamut), unpolarized JSC and FoM (shown in polar plots) for the optimal magenta (circular markers) and green (squared markers) cells in (a) planar layout, (b) linear gratings, (c) crossed gratings, (d) circular nanopillars, (e) domes, and (f) checkerboards. The incident angles of illumination (θ) varied between 0° and 60°, with a step of 10°. In the CIE gamuts, the marker size increases along with the angle.

