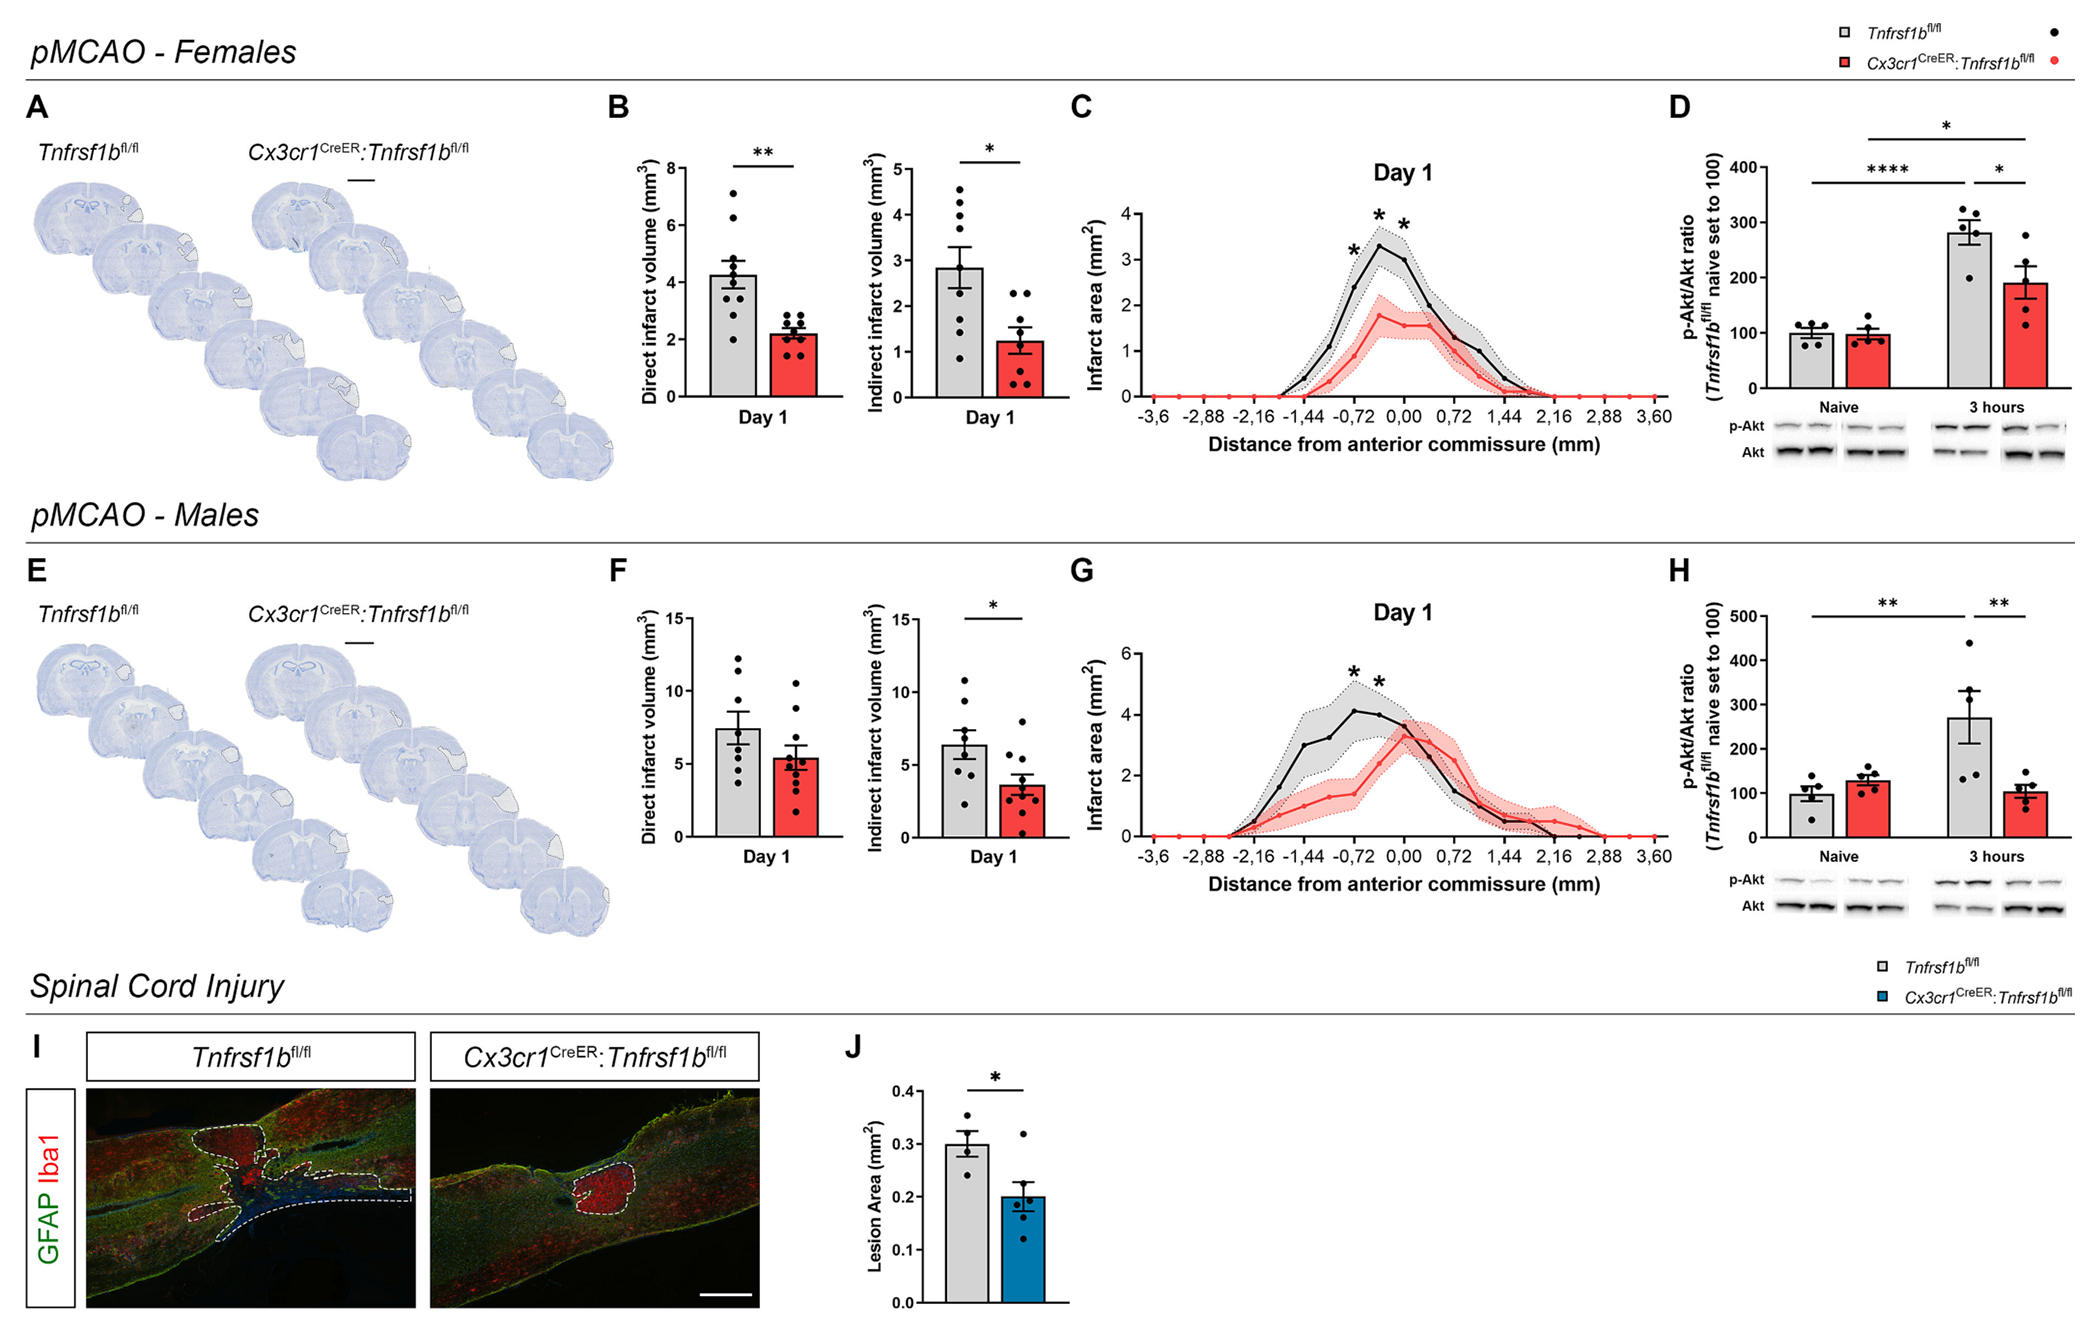
Fig. 1.

Conditional ablation of microglial TNFR2 affects lesion size in experimental models of ischemic stroke and spinal cord injury. (A) Representative images of toluidine blue-stained brain sections from female Cx3cr1CreER:Tnfrsf1bfl/fl mice and Tnfrsf1bfl/fl littermates at day 1 post-permanent middle cerebral artery occlusion (pMCAO). Scalebar: 5 mm. (B) Quantification of the direct and indirect infarct volumes in female Cx3cr1CreER:Tnfrsf1bfl/fl mice and Tnfrsf1bfl/fl littermates at day 1 post-pMCAO (direct: n = 9–10; indirect: n = 8–9). * p < 0.05, ** p < 0.01; Student’s t-test. (C) Rostrocaudal distribution of the ischemic infarct in female Cx3cr1CreER:Tnfrsf1bfl/fl mice and Tnfrsf1bfl/fl littermates at day 1 post-pMCAO (n = 9–10). * p < 0.05; Multiple t-test. (D) Quantification of p-Akt/Akt ratio in the brain of female Cx3cr1CreER:Tnfrsf1bfl/fl mice and Tnfrsf1bfl/fl littermates in naïve conditions and at 3 h post-pMCAO (n = 5/group). * p < 0.05, **** p < 0.0001; Two-way ANOVA (Interaction*, Time****, Genotype*) followed by Sidak’s multiple comparisons test. (E) Representative images of toluidine blue-stained brain sections from male Cx3cr1CreER:Tnfrsf1bfl/fl mice and Tnfrsf1bfl/fl littermates at day 1 post-pMCAO. Dashed lines delineate the ischemic infarct. Scalebar: 5 mm. (F) Quantification of the direct and indirect infarct volumes in male Cx3cr1CreER:Tnfrs1bfl/fl mice and Tnfrsf1bfl/fl littermates at day 1 post-pMCAO (direct: n = 8–10; indirect: n = 8–10). * p < 0.05; Student’s t-test. (G) Rostrocaudal distribution of the ischemic infarct in male Cx3cr1CreER:Tnfrsf1bfl/fl mice and Tnfrsf1bfl/fl littermates at day 1 post-pMCAO (n = 9–10). * p < 0.05; Multiple t-test. (H) Quantification of p-Akt/Akt ratio in the brain of male Cx3cr1CreER:Tnfrsf1bfl/fl mice and Tnfrsf1bfl/fl littermates in naïve conditions and at 3 h post-pMCAO (n = 5/group). ** p < 0.01; Two-way ANOVA (Interaction*, Time****, Genotype*) followed by Sidak’s multiple comparisons test. (I) Representative images of spinal cord lesions stained with the microglia/macrophage marker Iba1 and the astrocyte marker GFAP in female Cx3cr1CreER:Tnfrsf1bfl/fl mice and Tnfrsf1bfl/fl littermates at day 28 after spinal cord injury (SCI). Dashed lines delineate SCI lesions. Scalebar: 200 μm. (J) Quantification of lesion area in female Cx3cr1CreER:Tnfrsf1bfl/fl mice and Tnfrsf1bfl/fl littermates at day 28 after SCI (n = 4–6). * p < 0.05; Student’s t-test. (For interpretation of the references to color in this figure legend, the reader is referred to the web version of this article.)
