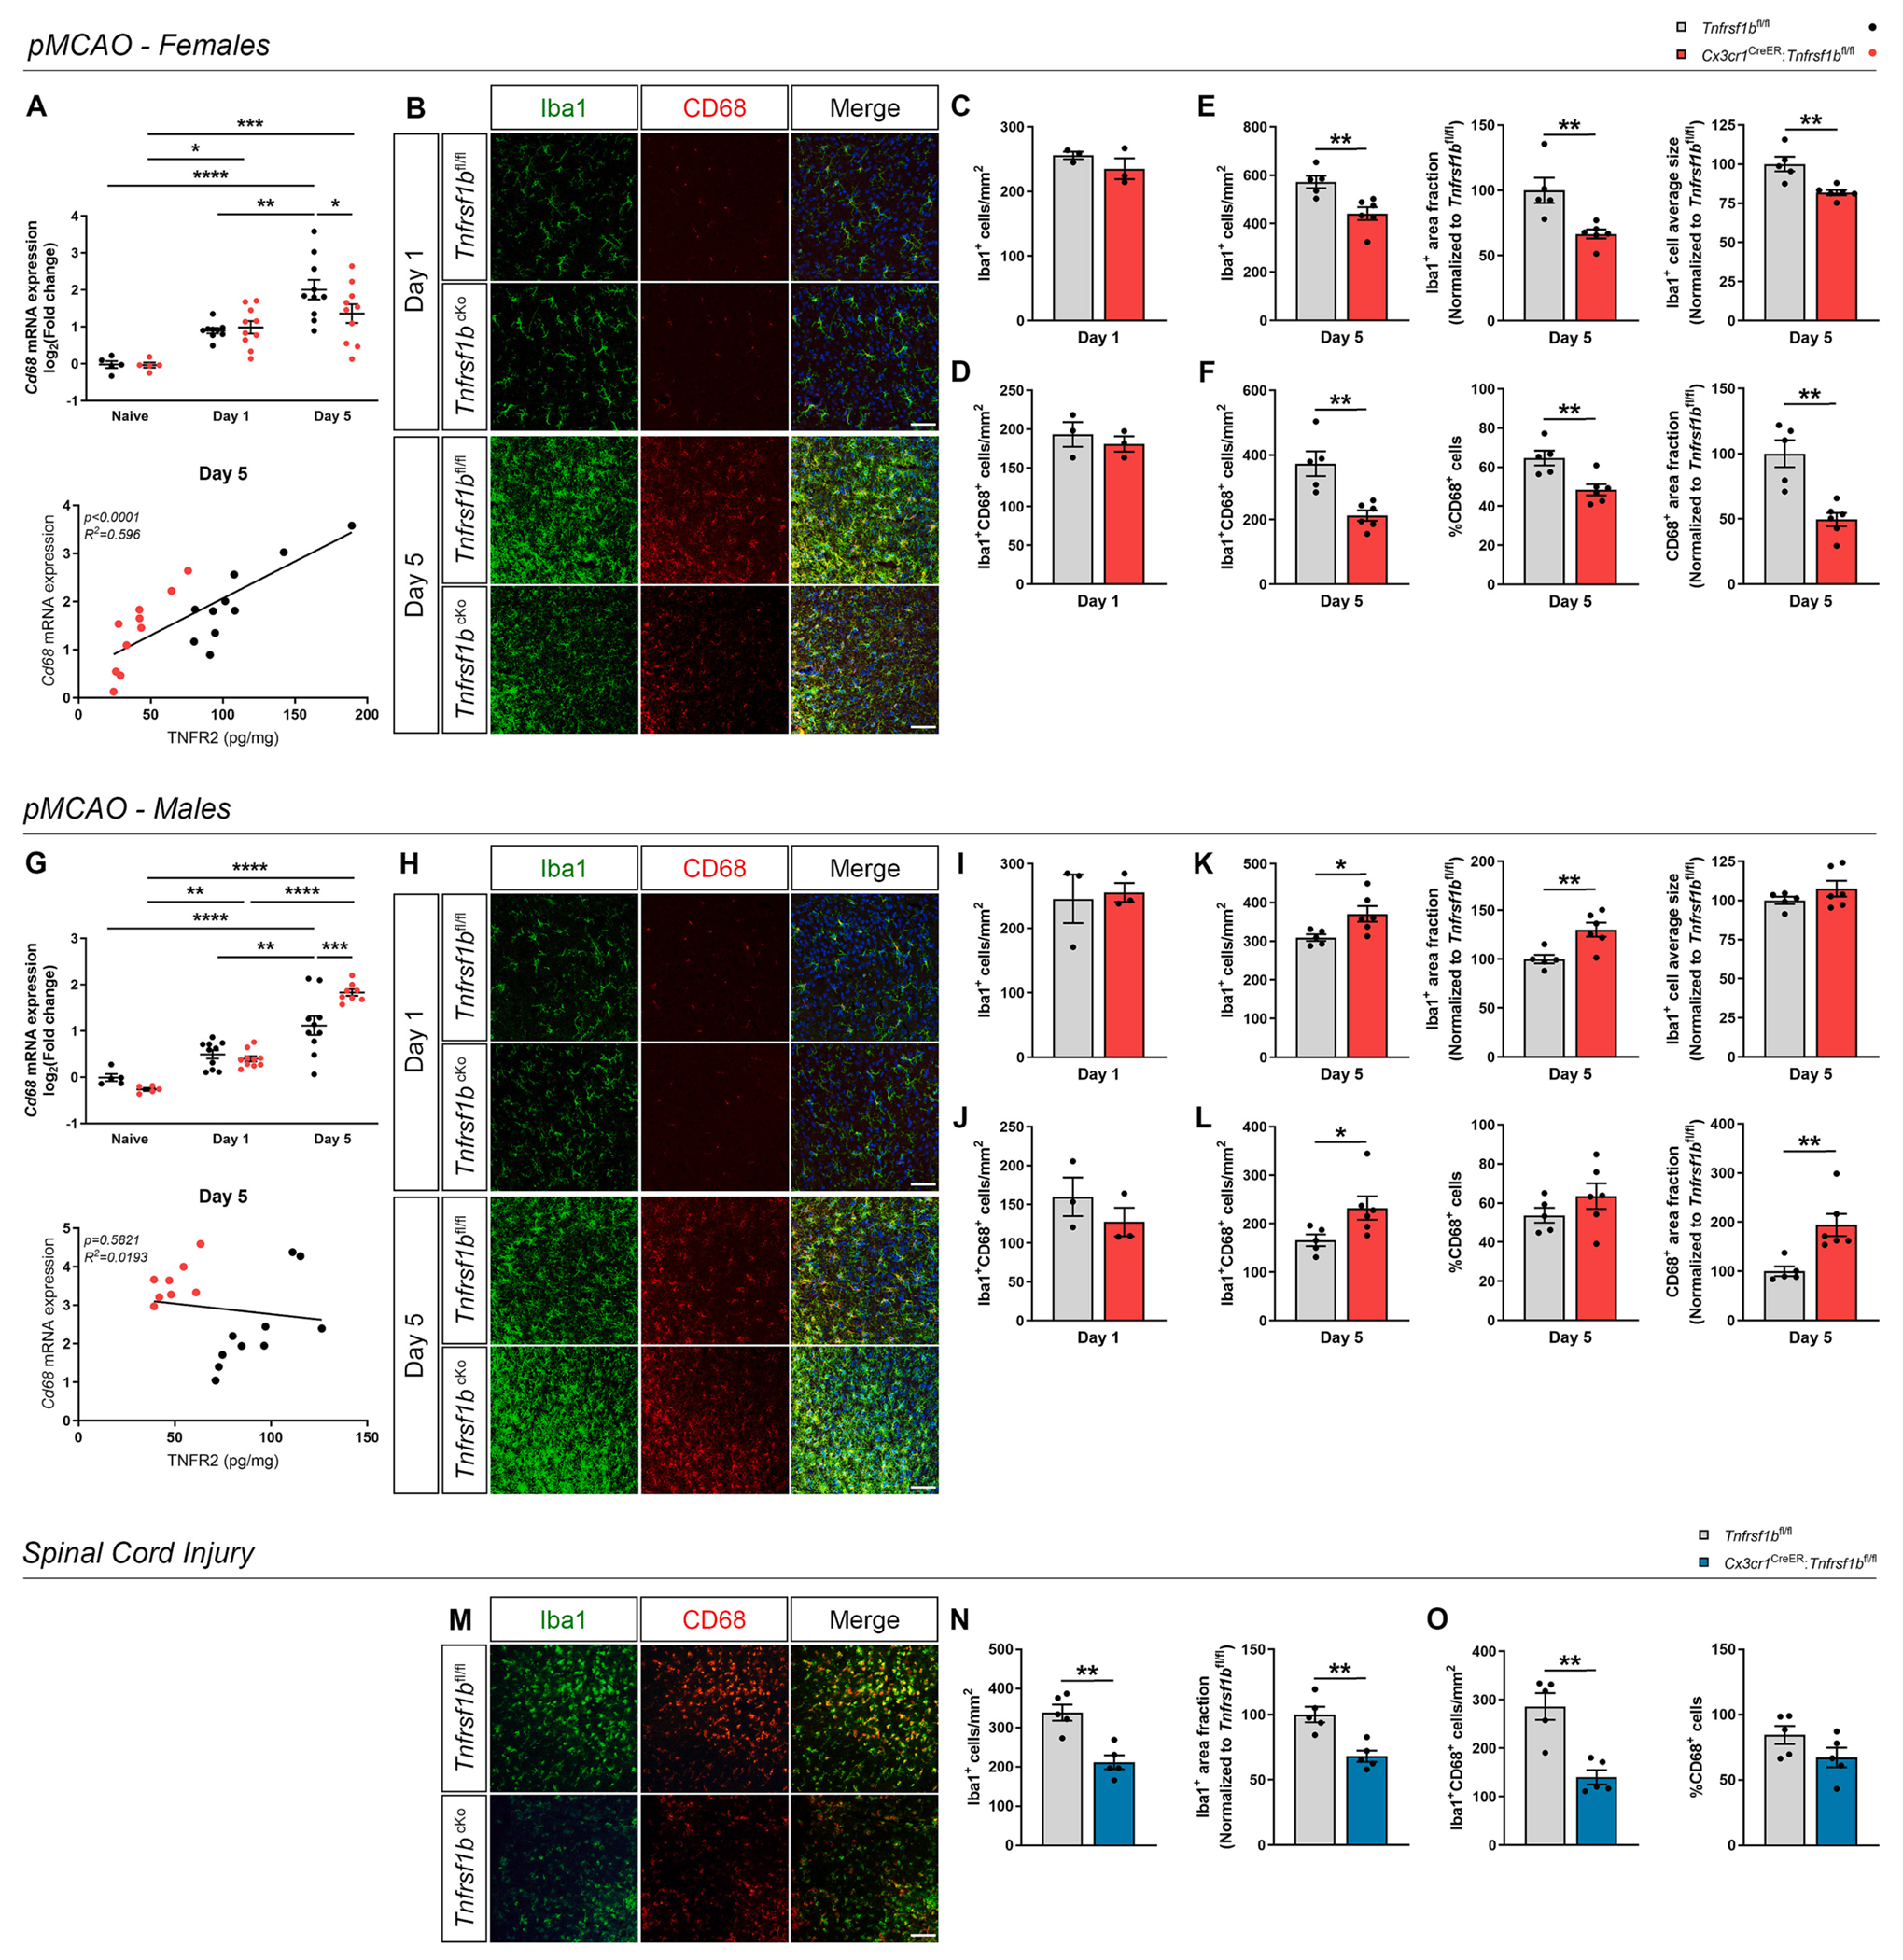
Fig. 5.

Conditional ablation of microglial TNFR2 affects microglial activation after ischemic stroke and spinal cord injury. (A) Quantification of Cd68 mRNA expression in the brain of female Cx3cr1CreER:Tnfrsf1bfl/fl mice and Tnfrsf1bfl/fl littermates in naïve conditions and at day 1 and 5 post-pMCAO (n = 5–10/group) and scatterplot representation of the linear correlation between TNFR2 protein levels (x axis) and Cd68 mRNA expression (y axis) at day 5 post-pMCAO (n = 10/group). * p < 0.05, ** p < 0.01, *** p < 0.001, **** p < 0.0001; Two-way ANOVA (Interactionns, Time****, Genotypens) followed by Bonferroni’s multiple comparisons test. For correlation analysis, two-tailed Pearson test was used. (B) Representative images of cells stained for Iba1 and CD68 at the boundary of the ischemic lesion (0–500 μm) in female Cx3cr1CreER:Tnfrsf1bfl/fl (Tnfrsf1bcKo) mice and Tnfrsf1bfl/fl littermates at day 1 and 5 post-pMCAO. Scale bar: 50 μm. (C-D) Quantification of Iba1+ (C) and Iba1+CD68+ cell density (D) at the boundary of the ischemic lesion (0–500 μm) in female Cx3cr1CreER:Tnfrsf1bfl/fl mice and Tnfrsf1bfl/fl littermates at day 1 post-pMCAO (n = 3/group). (E-F) Quantification of Iba1+ cell density, Iba1+ area fraction, Iba1+ average cell size (E), and of Iba1+CD68+ cell density, percentage of CD68+ cells, CD68+ area fraction (F) at the boundary of the ischemic lesion (0–500 μm) in female Cx3cr1CreER:Tnfrsf1bfl/fl mice and Tnfrsf1bfl/fl littermates at day 5 post-pMCAO (n = 5–6/group). ** p < 0.01; Student’s t-test. (G) Quantification of Cd68 mRNA expression in the brain of male Cx3cr1CreER:Tnfrsf1bfl/fl mice and Tnfrsf1bfl/fl littermates in naïve conditions and at day 1 and 5 post-pMCAO (n = 5–10/group) and scatterplot representation of the linear correlation between TNFR2 protein levels (x axis) and Cd68 mRNA expression (y axis) at day 5 post-pMCAO (n = 10/group). * p < 0.05, ** p < 0.01, *** p < 0.001, **** p < 0.0001; Two-way ANOVA (Interaction***, Time****, Genotypens) followed by Bonferroni’s multiple comparisons test. For correlation analysis, two-tailed Pearson test was used. (H) Representative images of cells stained for Iba1 and CD68 at the boundary of the ischemic lesion (0–500 μm) in male Cx3cr1CreER:Tnfrsf1bfl/fl (Tnfrsf1bcKo) mice and Tnfrsf1bfl/fl littermates at day 1 and 5 post-pMCAO. Scale bar: 50 μm. (I-J) Quantification of Iba1+ (I) and Iba1+CD68+ cell density (J) at the boundary of the ischemic lesion (0–500 μm) in male Cx3cr1CreER:Tnfrsf1bfl/fl mice and Tnfrsf1bfl/fl littermates at day 1 post-pMCAO (n = 3/group). (K-L) Quantification of Iba1+ cell density, Iba1+ area fraction, Iba1+ average cell size (K), and of Iba1+CD68+ cell density, percentage of CD68+ cells, CD68+ area fraction (L) at the boundary of the ischemic lesion (0–500 μm) in male Cx3cr1CreER:Tnfrsf1bfl/fl mice and Tnfrsf1bfl/fl littermates at day 5 post-pMCAO (n = 6/group). * p < 0.05, ** p < 0.01; Student’s t-test. (M) Representative images of cells stained for Iba1 and CD68 in the peri-lesion area of female Cx3cr1CreER:Tnfrsf1bfl/fl (Tnfrsf1bcKo) mice and Tnfrsf1bfl/fl littermates at day 28 post-SCI. Scale bar: 50 μm. (N-O) Quantification of Iba1+ cell density, Iba1+ area fraction (N), and of Iba1+CD68+ cell density, percentage of CD68+ cells (O) in the peri-lesion area of female Cx3cr1CreER:Tnfrsf1bfl/fl mice and Tnfrsf1bfl/fl littermates at day 28 post-SCI (n = 5/group). ** p < 0.01; Student’s t-test.
