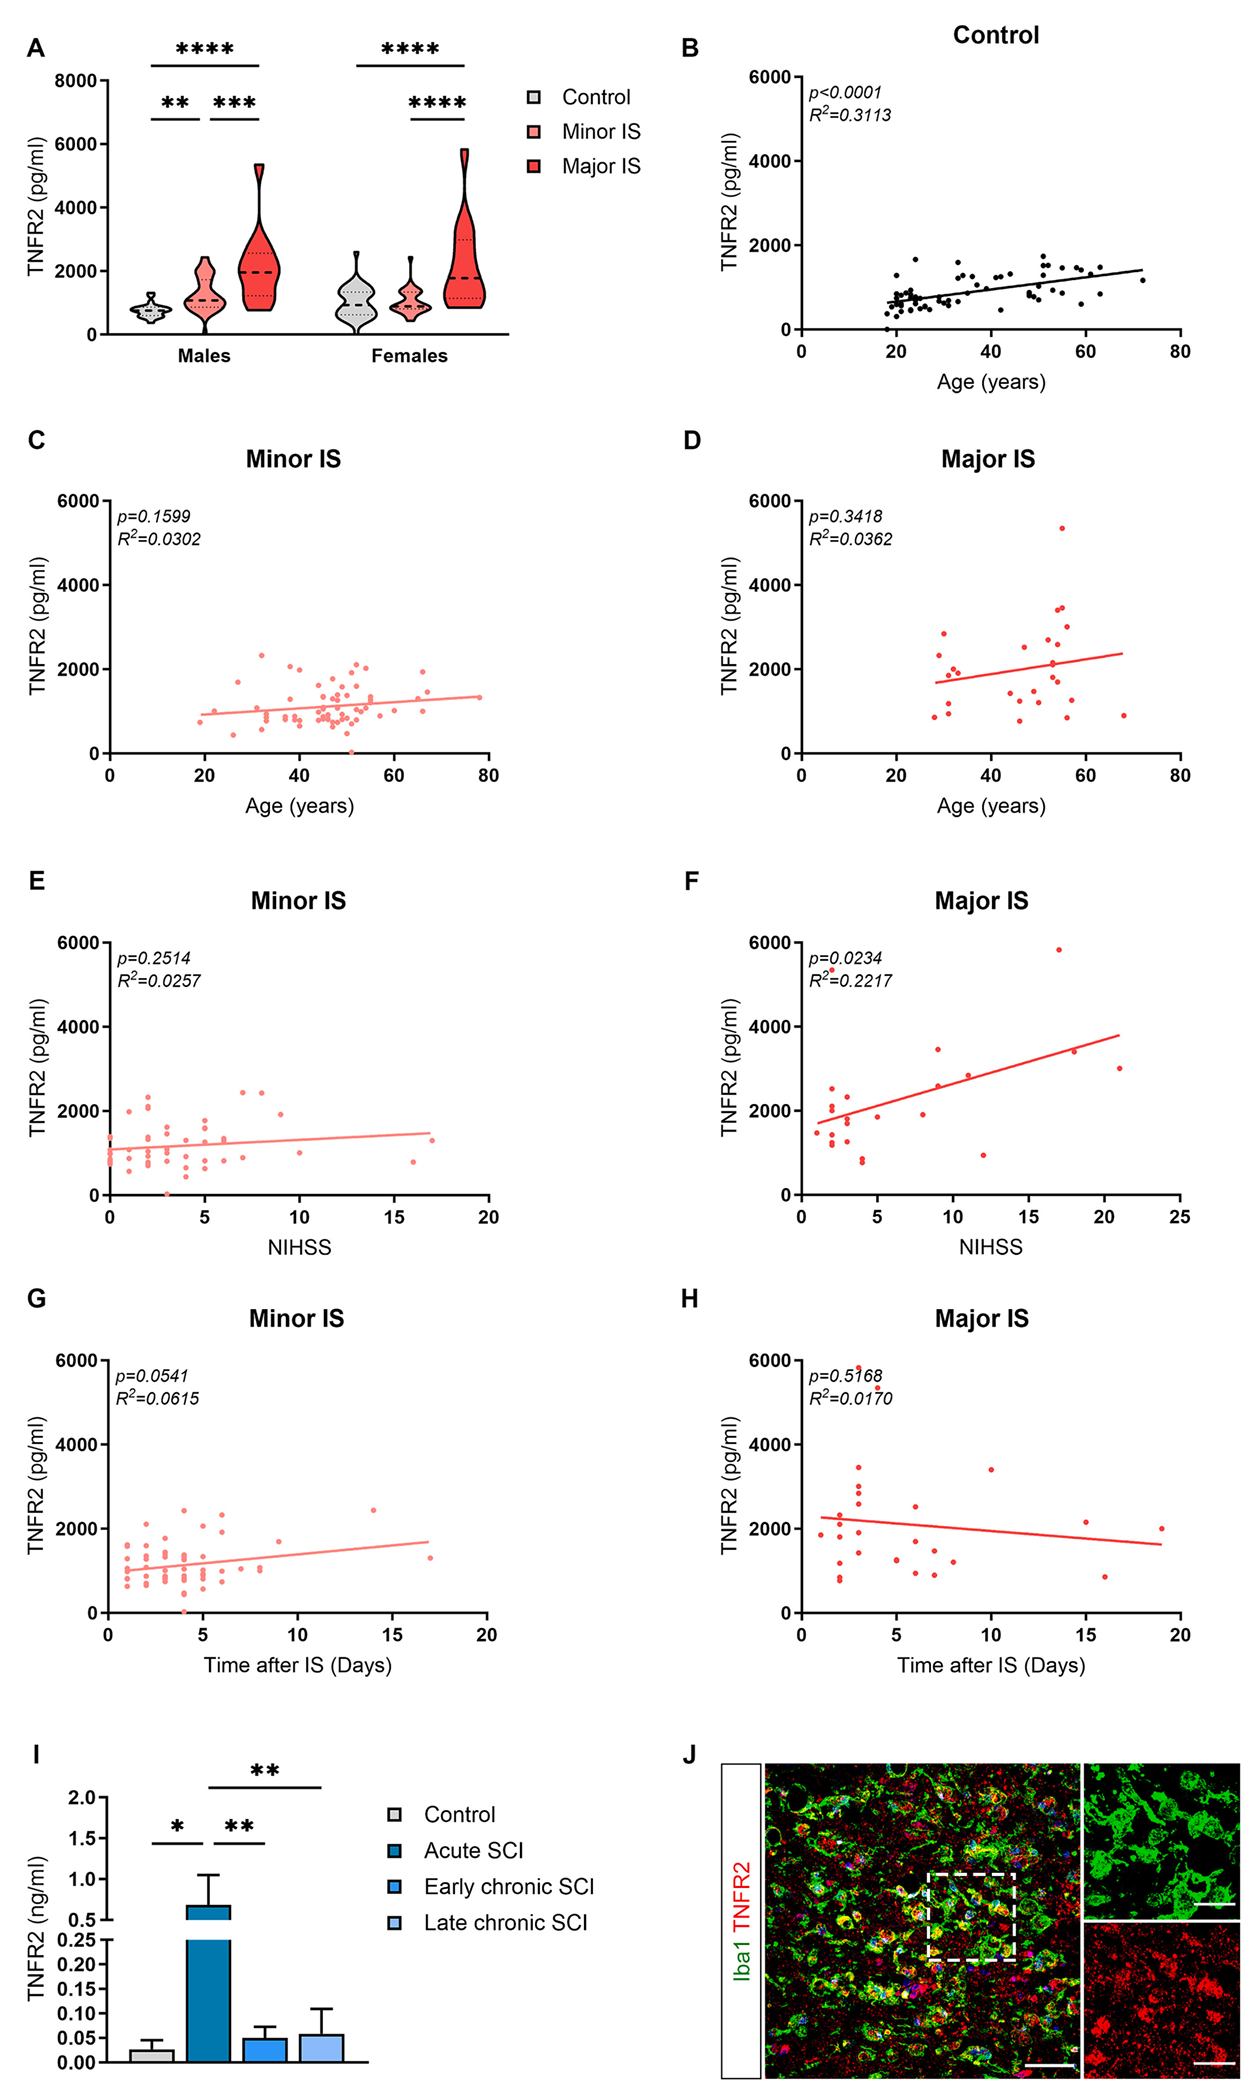
Fig. 6.

TNFR2 levels are increased in the cerebrospinal fluid of patients affected by ischemic stroke and spinal cord injury. (A) Quantification of TNFR2 protein levels in the cerebrospinal fluid (CSF) of male and female healthy controls (n = 25–42) and patients with minor (n = 37–31) and major (n = 14–14) ischemic stroke (IS). ** p < 0.01, *** p < 0.001, **** p < 0.0001; Two-way ANOVA (Interactionns, Sexns, Severity****) followed by Sidak’s multiple comparison test. (B-D) Scatterplot representation of the linear correlation between age (x axis) and TNFR2 protein levels (y axis) in the CSF of sex-mixed healthy controls (B, n = 66) and patients with minor (C, n = 67) and major (D, n = 27) IS. For correlation analysis, two-tailed Pearson test was used. (E-F) Scatterplot representation of the linear correlation between National Institute of Health Stroke Scale (NIHSS, x axis) and TNFR2 protein levels (y axis) in the CSF of sex-mixed patients with minor (E, n = 53) and major (F, n = 23) IS. For correlation analysis, two-tailed Pearson test was used. (G-H) Scatterplot representation of the linear correlation between time after IS (x axis) and TNFR2 protein levels (y axis) in the CSF of sex-mixed patients with minor (G, n = 61) and major (H, n = 27) IS. For correlation analysis, two-tailed Pearson test was used. (I) Quantification of TNFR2 protein levels in the CSF of healthy controls (n = 5) and patients with acute (n = 5), early chronic (n = 12), and late chronic (n = 11) spinal cord injury (SCI). ** p < 0.01; One-way ANOVA followed by Tukey’s multiple comparison test. (J) Representative image of cells stained for Iba1 and TNFR2 at the boundary of the ischemic lesion (0–500 μm) in a human stroke case. Scale bar: 50 μm. The enlargement shows cells double positive for Iba1 and TNFR2. Scale bar: 25 μm.
