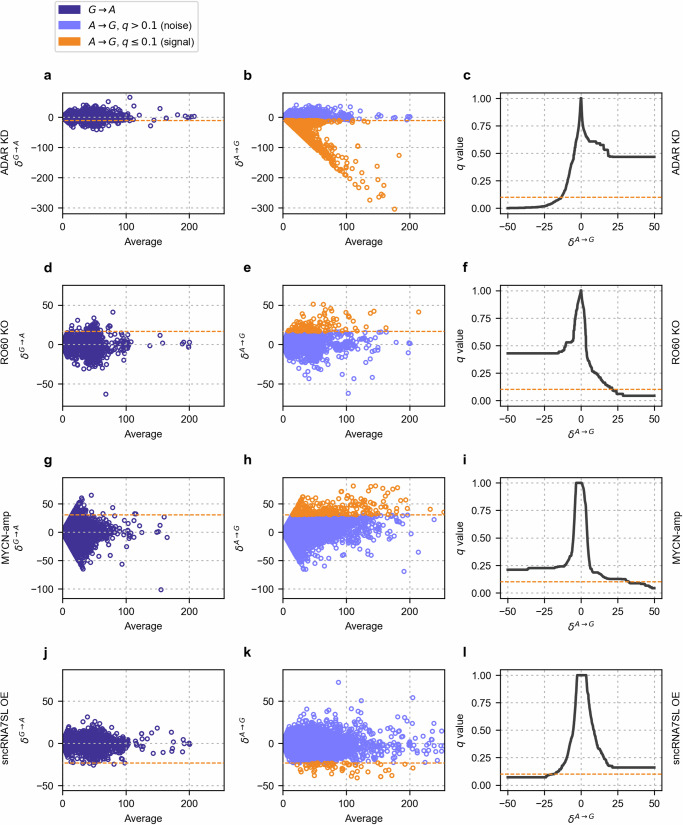
Fig. 2. Observed signal differences and empirically derived q values.
Rows correspond to the ADAR1 KD (a–c), RO60 KO (d–f), MYCN-amp (g–i), and sncRNA7SL OE (j–l) datasets. The left and middle columns show Bland–Altman plots51 of δG→A values considered as noise (left column), and δA→G values considered as a mixture of signal and noise (middle column). The third column shows empirical q values. Orange lines show the signal cutoffs derived by LoDEI corresponding to a q value ≤ 0.1 in columns 1 and 2 and a q value of 0.1 in column 3.

