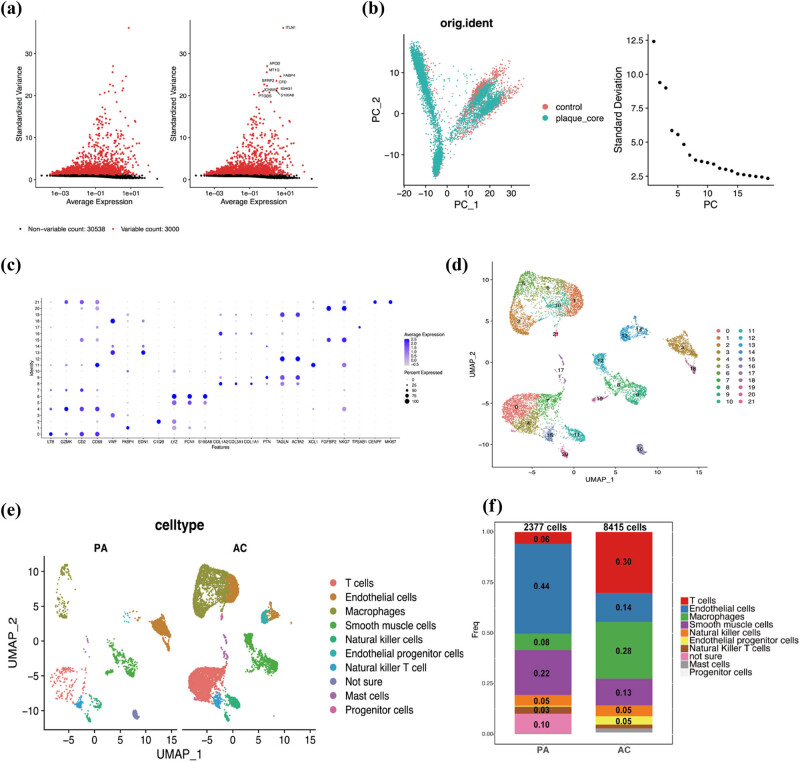
Figure 5.
Identification of cell clusters across plaque cells based on scRNA-seq. (a) 3,000 highly variable genes. (b) Dimensional reduction and PCA. (c) Dot plot shows the cell markers. (d) UMAP shows the 22 cell clusters. (e) and (f) Difference of cell types between AC and PA groups. AC: atherosclerotic core; PA: proximal adjacent portions of carotid artery.

