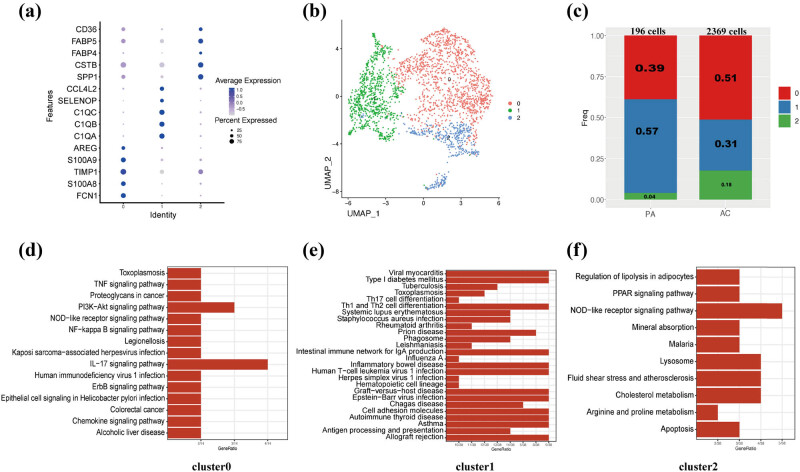
Figure 7.
Functional and spatial signatures of macrophage subpopulations. (a) Dot plot shows the cell markers. (b) UMAP shows the three cell clusters. (c) Amount of three cell clusters. (d) KEGG analysis of cluster 0 of macrophage. (e) KEGG analysis of cluster 1 of macrophage. (f) KEGG analysis of cluster 2 of macrophage.

