FIGURE 2.

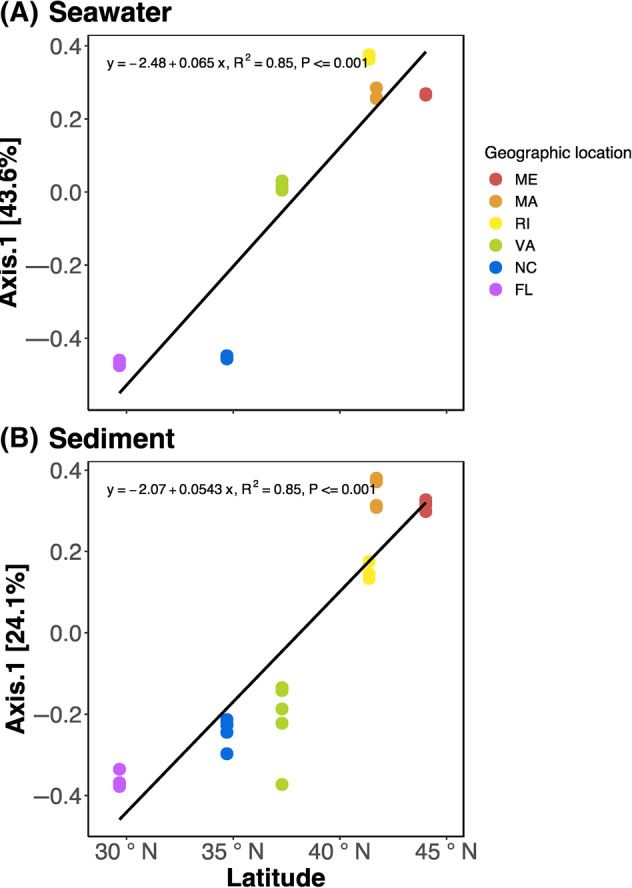
Scatter plot showing the relationship between Bray–Curtis dissimilarity distances along the first principal coordinates axis and latitude of (A) seawater and (B) sediment microbial communities in the sampled geographic locations.

Scatter plot showing the relationship between Bray–Curtis dissimilarity distances along the first principal coordinates axis and latitude of (A) seawater and (B) sediment microbial communities in the sampled geographic locations.