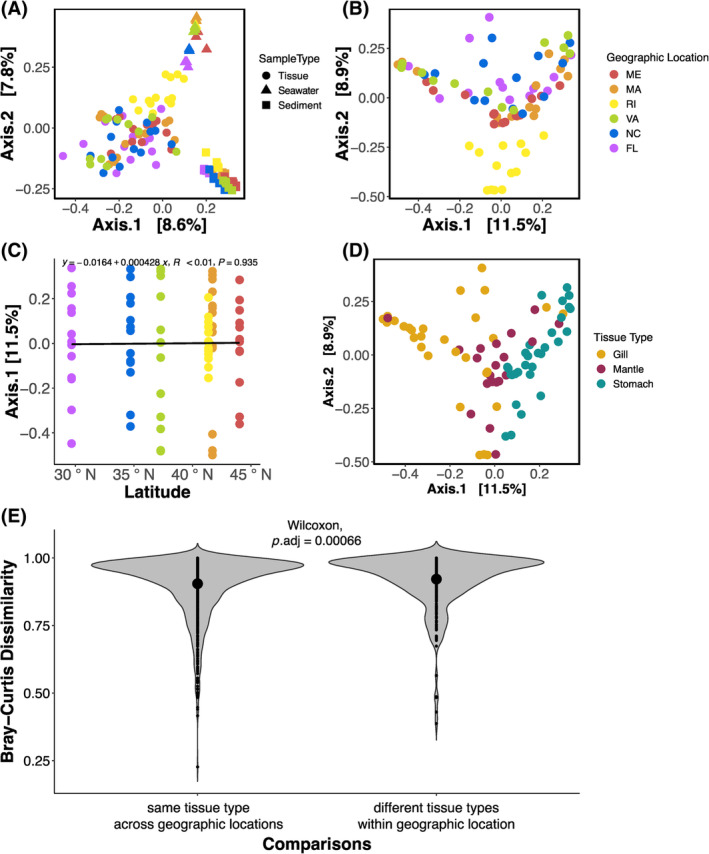
FIGURE 3.

Bray–Curtis dissimilarities of microbial communities associated with oyster tissues and their surrounding seawater and sediment, visualized with principal coordinate analysis (PCoA) (A) across all sample types, and specific to oyster tissues (B) coloured by geographic location or (D) tissue type. As well as a (C) scatterplot showing no relationship between Bray–Curtis dissimilarity distances along the first principal coordinates axis and latitude of tissue‐associated microbial communities. Finally, (E) violin plot showing oyster‐associated microbial communities compared with the same tissue type across all geographic locations (e.g., gill from ME compared with gill from FL) and compared with different tissue types within the same geographic location (e.g., gill form ME compared with stomach from ME). Large dots inside the violin plot indicate group means.
