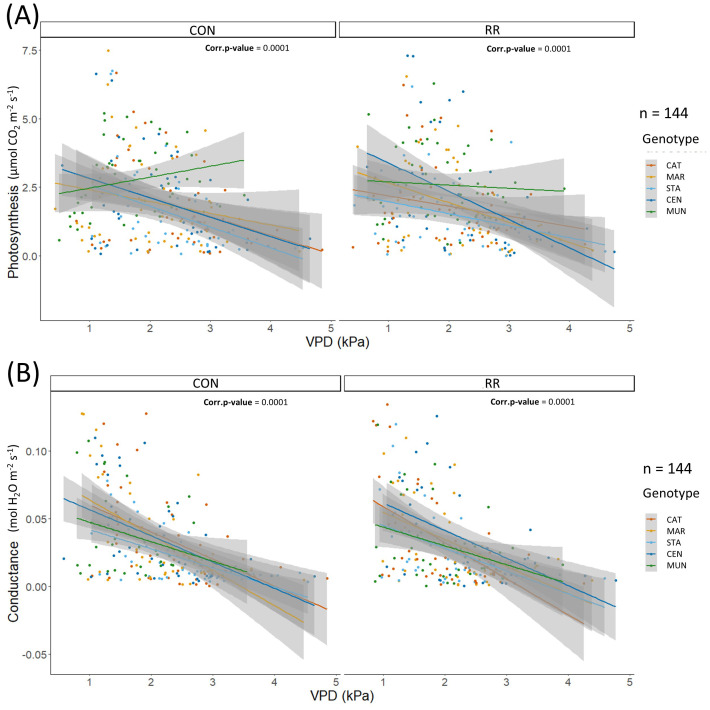
Figure 4.
(A) Photosynthesis (expressed in µmol CO2 m-2 LA s-1), (B) conductance (expressed in mol H2O m-2 LA s-1) in function of hourly VPD in kPa for the rain-fed (CON) vs rain reduction (RR) treatments of the 5 genotypes (CAT: Catimor, MAR: Marsellesa, STA: Starmaya, CEN: Centroamericano, MUN: Mundo Maya). Colored lines are simple linear models and grey areas are confidence intervals.

