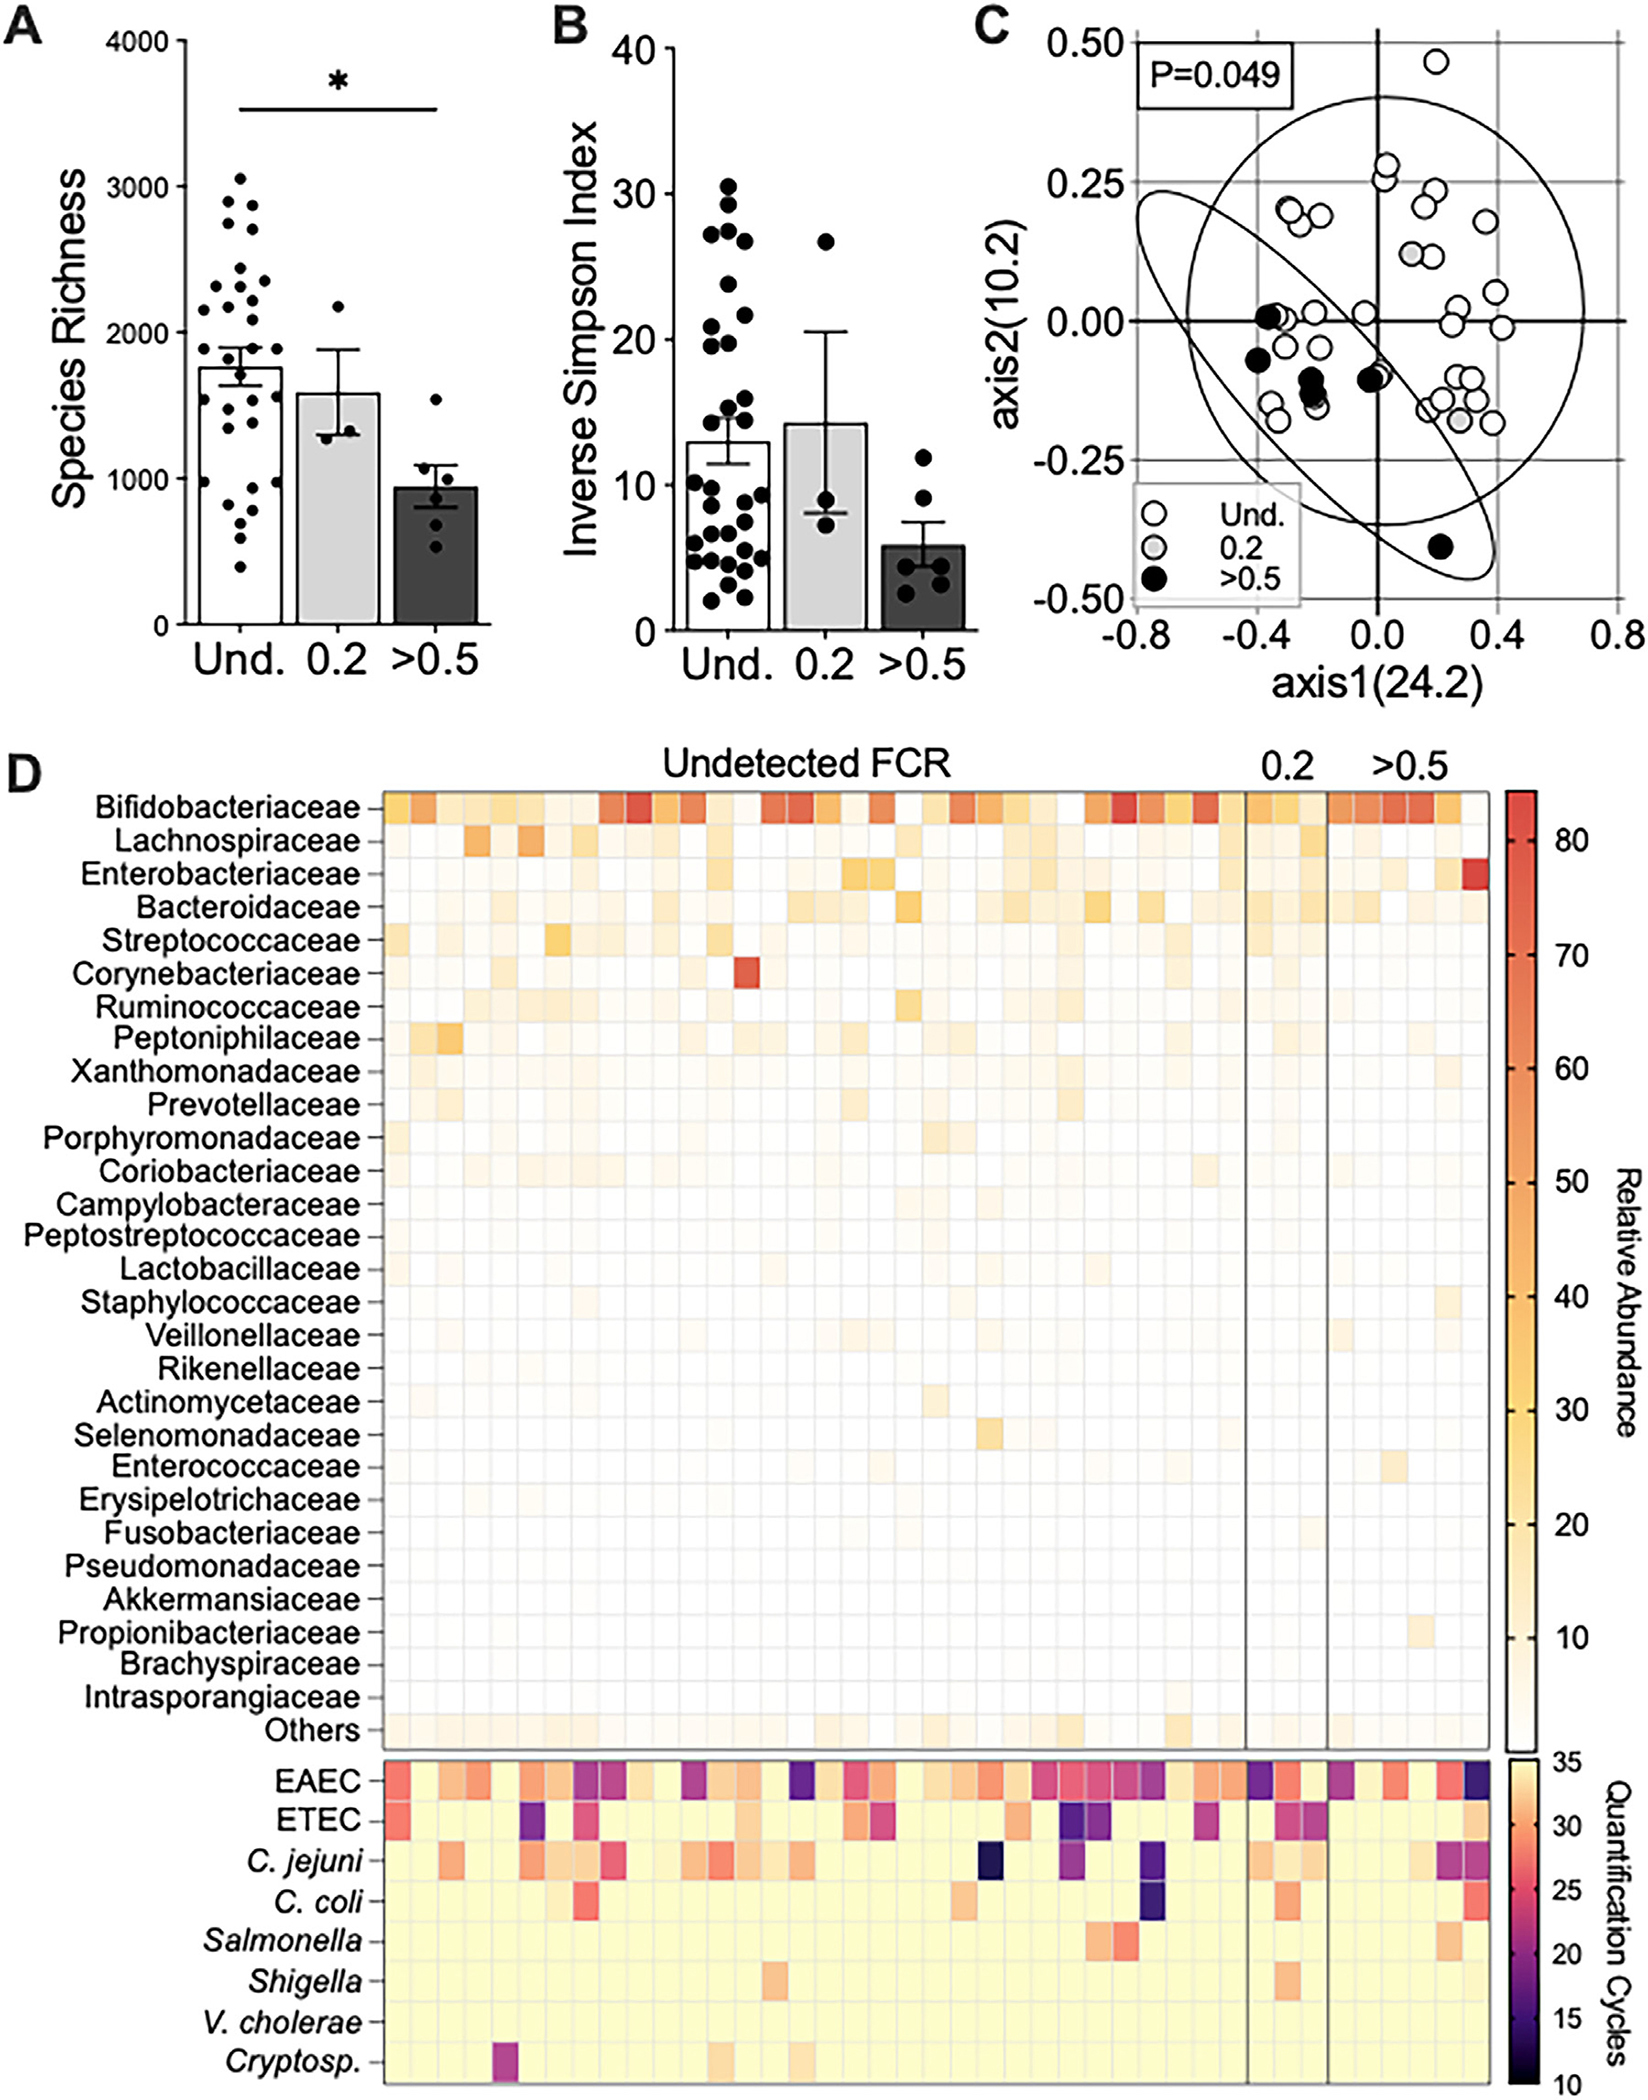
Figure 2.

Infants in households with high FCR in the drinking water have a less diverse microbiome. Rectal swabs of participants were sequenced for bacteria using whole-genome sequencing. (a) Species richness with Kruskall–Wallis test and Dunn’s multiple comparisons test, P = 0.04 between undetected (Und.) and >0.5 FCR groups. (b) Alpha-diversity using Inverse Simpson by Kruskall–Wallis test (P > 0.05). Mann-Whitney test of Und. and >0·5 FCR, P = 0·045. Data shown as mean ± SEM; each dot resembles a participant. (c) Beta-diversity using Bray Curtis Dissimilarity index at the family level; values in parentheses are percent explained by axes and ellipses drawn on 95% CI; P = 0·049 for AMOVA comparison of ellipse centroid position. Three samples with FCR of 0·2 are removed because sample size is insufficient for the comparison. (d) Heatmap representation of family-level abundance (top) and enteric pathogen burden (bottom) per participant.
