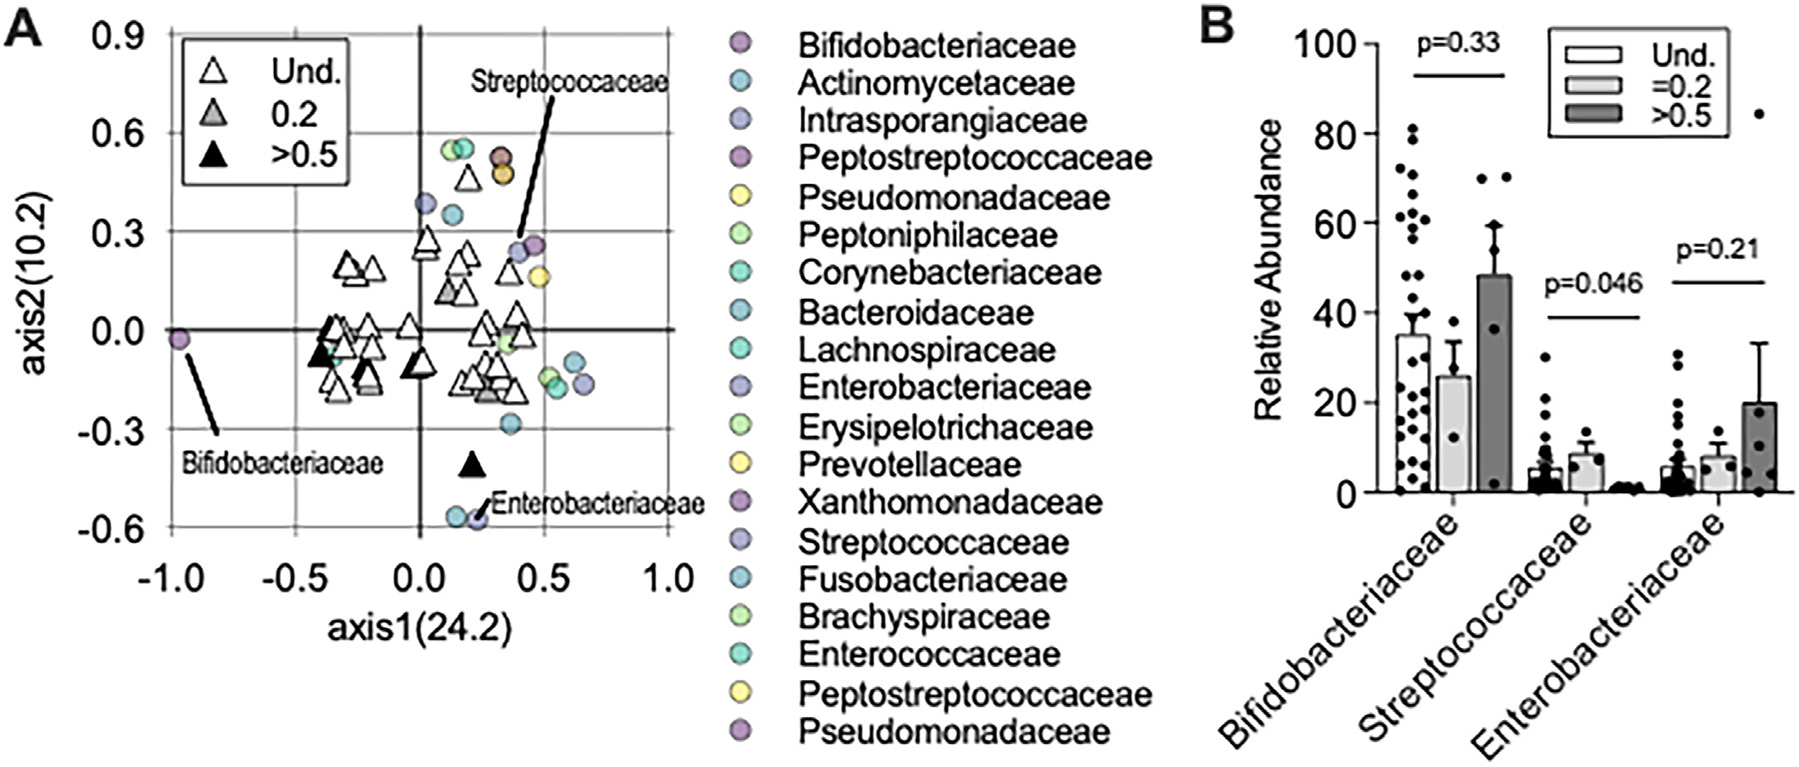
Figure 3.

Infants in households with high FCR were predominant in Bifidobacteriaceae. (a) PCoA of Bray-Curtis Dissimilarity index using family-level identification of infant microbiota; values in parentheses are percent explained by axes. Correlation coefficients were calculated for each taxonomic family and plotted overlying the individual study participant PCoA. Triangles = Shading represents FCR levels in households, and one triangle is shown per individual. Circles = bacterial families. Only bacterial families with greater than 1% microbial abundance and a P value < 0·01 Pearson correlation coefficient are shown. (b) Relative abundance of 3 abundant microbial families shown by FCR levels. Mann-Whitney test of Undetected (Und.) and >0·5 FCR is shown; 2way ANOVA comparison among all three groups is P > 0·05.
