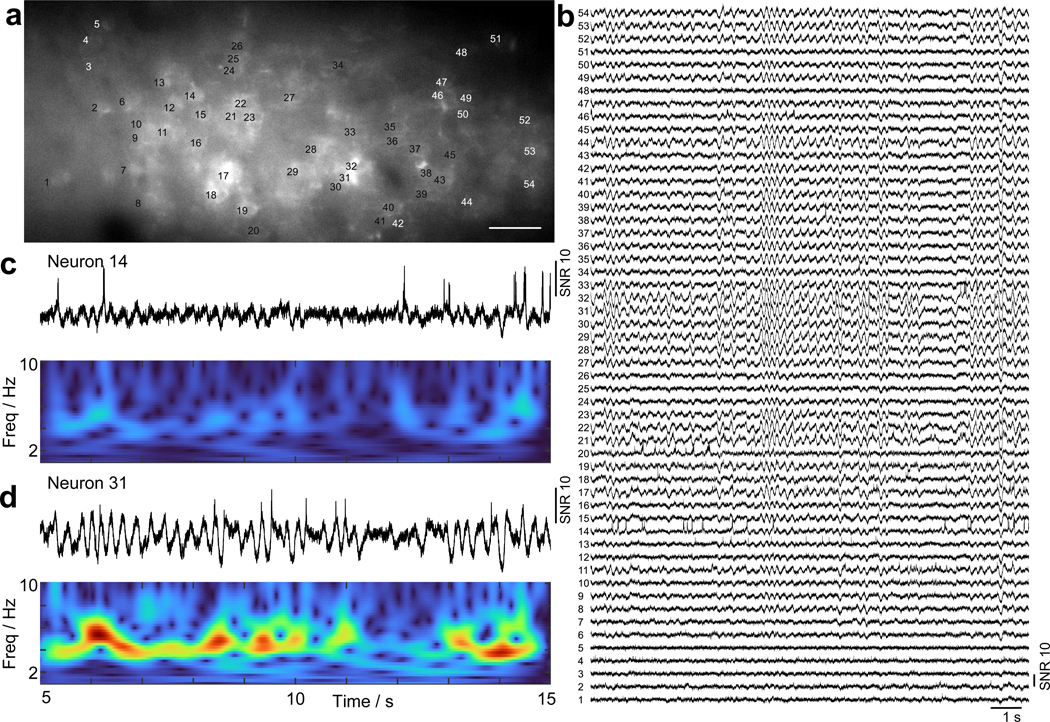
Extended Data Fig. 7. Observation of highly synchronized 3 – 5 Hz membrane oscillations in L1 interneurons.
(a) Confocal image of GFP fluorescence over the imaging FOV. Scale bar, 50 μm. (b) SomArchon fluorescence traces for all the neurons labeled in (a). Scale bar, 50 μm. (c,d) Zoomed-in fluorescence traces (top panel) of two selective neurons and their corresponding power spectra (bottom panel).

