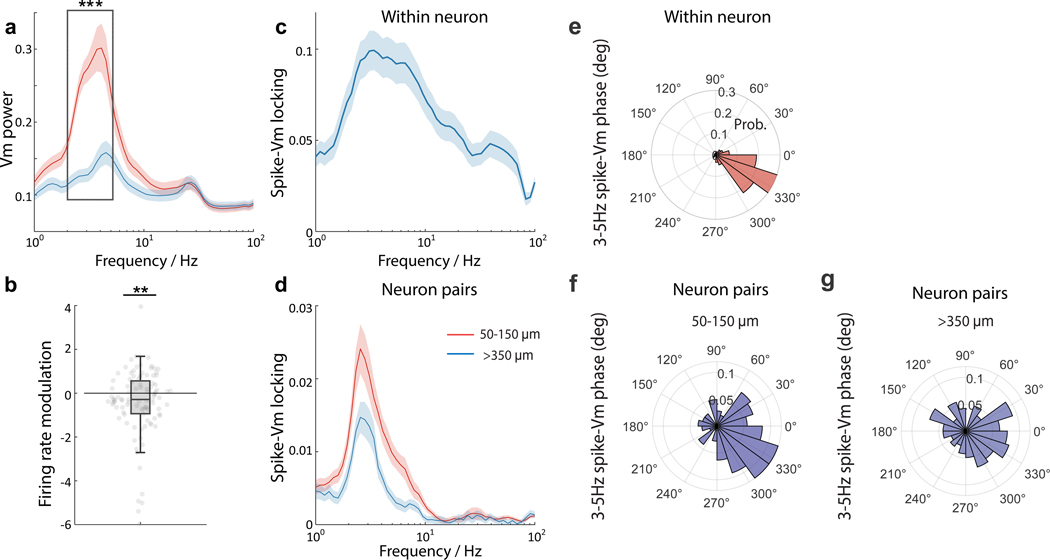
Extended Data Fig. 8. Analysis of voltage traces recorded from the animal in Extended Data Fig. 7, Supplementary Fig. 16.
(a) Frequency-resolved Vm power averaged from time periods with high delta population Vm power (> 2 standard deviation, S.D.; red trace) and low Vm power (< 2 S.D.; blue trace). Within 2 – 5 Hz frequency range (black box), most neurons showed significant Vm delta power modulation (paired student t-test, ***p = 3.27e−12, n = 99 neurons with average spike rate ≥ 1 Hz, 8 FOVs from 1 mouse). Solid line, mean; shaded area, ± 1 S.D. (b) Firing rate modulation of neurons from periods of high Vm delta power relative to periods of low Vm delta power. Paired student t-test, **p = 0.009, n = 99 neurons with average spike rate ≥ 1 Hz, 8 FOVs from 1 mouse. Box plots same as Fig. 2(e). (c) Frequency-resolved spike-Vm phase locking for all neurons. Solid line, mean; shaded area, ± 1 S.D. (d) Frequency-resolved spike-Vm phase locking between neuron pairs. Red trace, neuron pairs with separation distances between 50 – 150 μm; blue trace, neuron pairs with separation distances > 350 μm. Solid line, mean; shaded area, ± 1 S.D. (e-g) Polar plots of spike phase distribution relative to the 3–5 Hz Vm oscillations within individual neurons (e), and between neuron pairs across separation distances in the range 50 – 150 μm (f) and > 350 μm (g).

