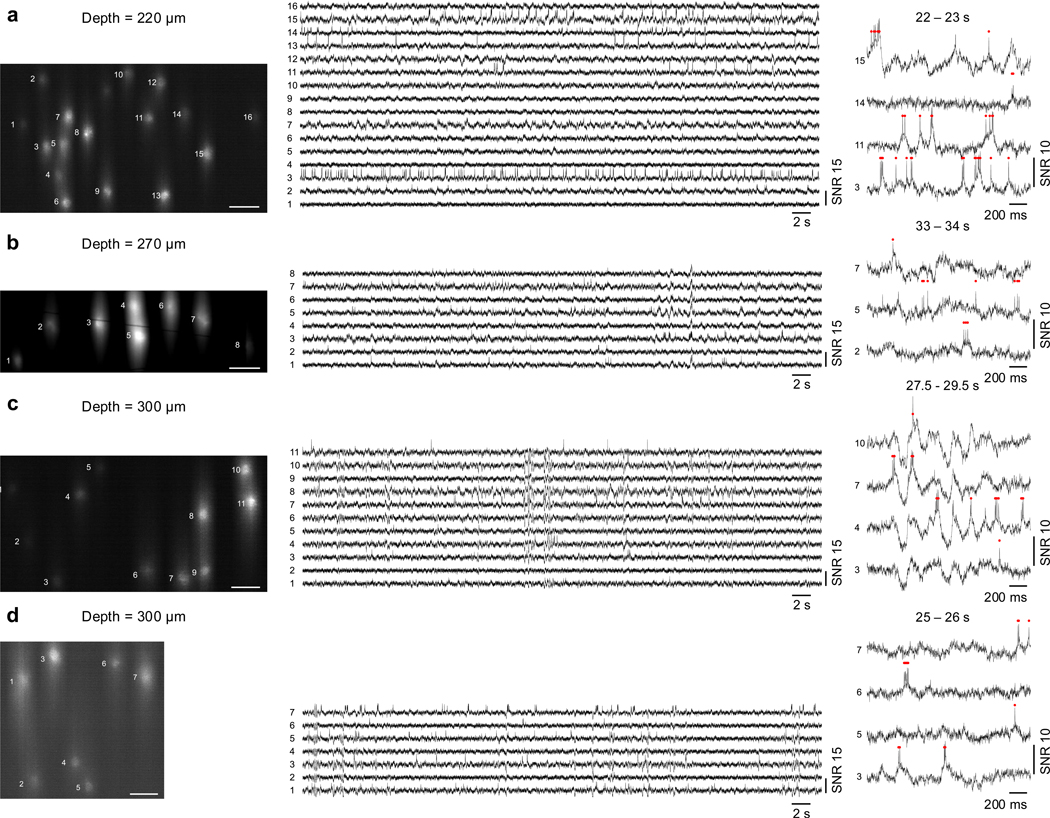
Extended Data Fig. 9. Additional datasets for in vivo imaging of Voltron2 fluorescence at depths greater than 200 μm.
Imaging depths from (a) to (d) are 220, 270, 300, and 300 μm. Left column, averaged Voltron2 fluorescence image. Scale bars are 50 μm. Middle column, Voltron2 fluorescence traces from corresponding labeled neurons over 60 s recordings. Right column, zoomed-in fluorescence traces of active neurons during 2 s clips.

