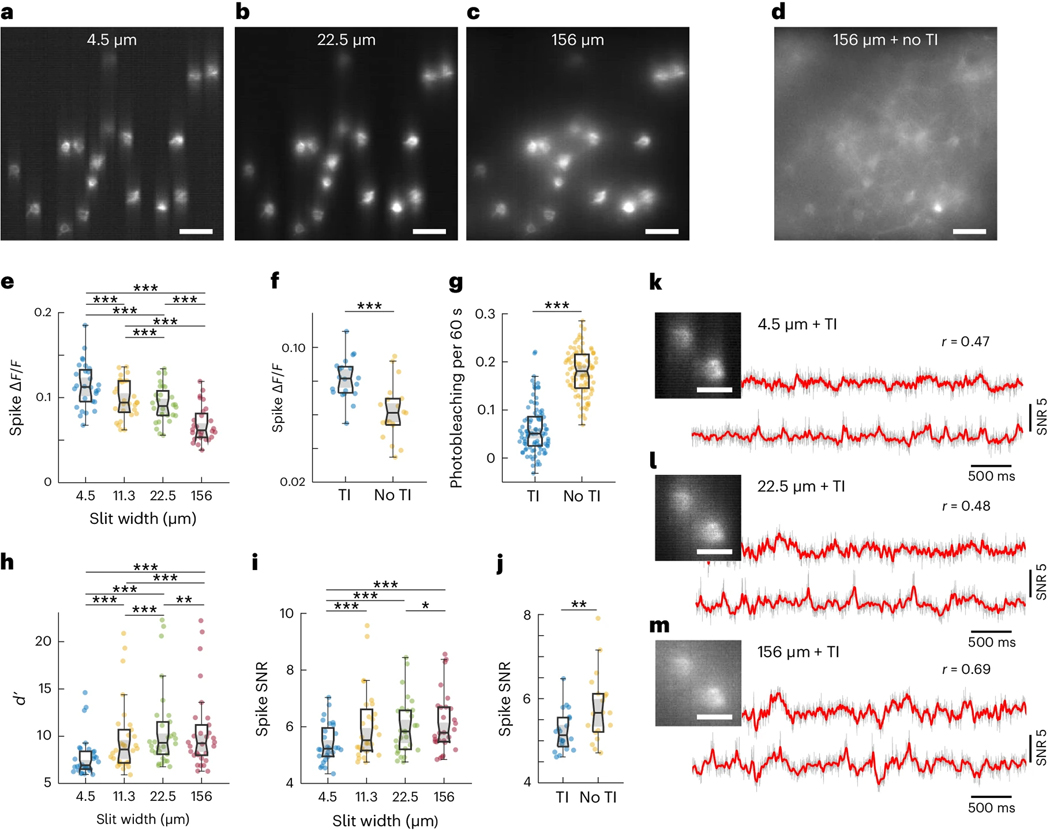
Figure 2. Quantification of TICO microscope performance for in vivo voltage imaging.
(a-c) Example Voltron2 fluorescence images under targeted illumination with confocal slit width set to 4.5, 22.5, and 156 μm. Scale bar 50 μm.
(d) Voltron2 fluorescence image over the same FOV but acquired without targeted illumination and with a confocal slit width of 156 μm. TI, targeted illumination. Scale bar 50 μm.
(e,h,i) Comparison of spike , spike detection fidelity , and spike SNR measured with targeted illumination and confocal slit widths of 4.5, 11.3, 22.5, and 156 μm (Two-sided Wilcoxon signed rank test; n = 30 cells from 6 FOVs, 2 mice). Box plots: box, 25th (Q1, bottom line) to 75th (Q3, top line) percentiles; whiskers, to , where ; middle line, median (m); notch, from to ; dots, measurement points.
*p < 0.05, **p < 0.01, ***p < 0.001, no label if p ≥ 0.05, pairwise Wilcoxon signed-rank test, see Source Data Fig. 2 for statistics.
(f,g,j) Comparison of spike , photobleaching rate, and spike SNR measured with and without targeted illumination when using a 14 μm confocal slit. Two-sided Wilcoxon signed rank test. For (f,j), n = 20 cells from 5 FOVs, 2 mice. For (g), n = 92 cells from 5 FOVs, 2 mice. Box plots same as (e), see Source Data Fig. 2 for statistics.
(k,l,m) Example images (scale bar, 20 μm) and corresponding fluorescence traces from two neighboring neurons with targeted illumination and confocal slit widths of 4.5, 22.5, and 156 μm (from top to bottom). Gray line, fluorescence traces; red line, extracted subthreshold Vm traces; r, Pearson cross-correlation coefficient between the subthreshold Vm traces from the 2 neurons.

