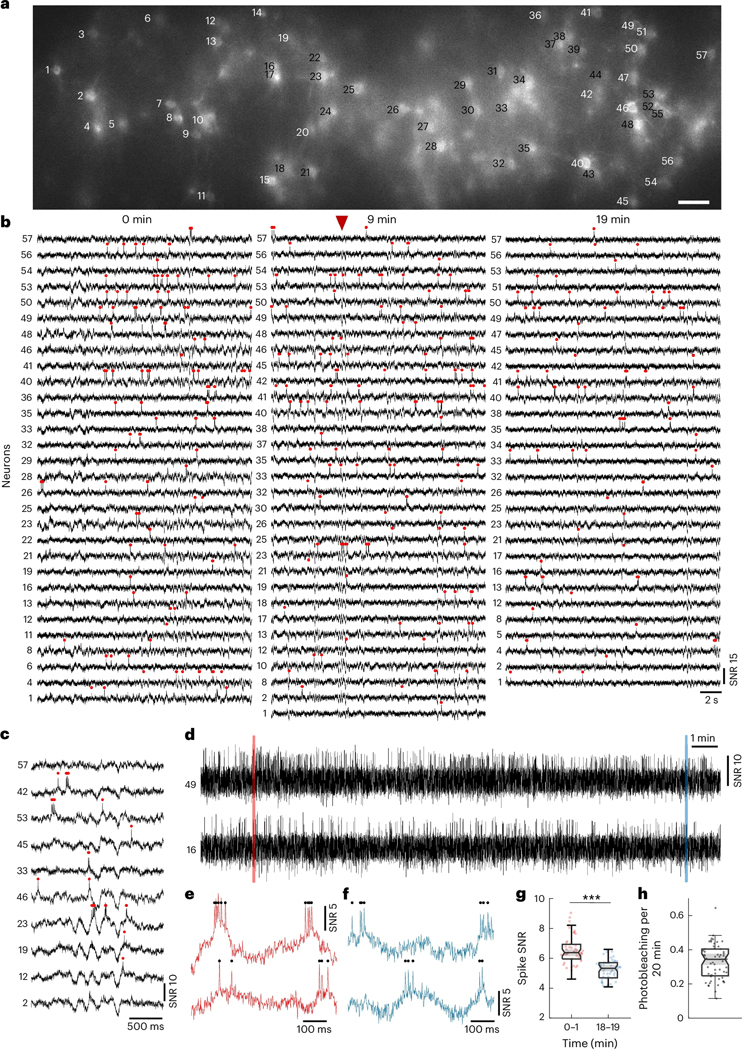
Figure 3. TICO microscope enables in vivo voltage imaging at large scales over extended durations.
(a) Confocal image of Voltron2 fluorescence over the imaging FOV. Imaging depth 160 ± 20 μm, excitation intensity 40 mW/mm2, scale bar 50 μm. See Extended Data Fig. 5a for the averaged Voltron2 fluorescence image over the same FOV with both confocal and targeted illumination.
(b) Voltron2 fluorescence traces of active cells over 20 s periods starting at 0, 9, and 19 min in the recording. See Extended Data Fig. 5b for the entire 20 min recording of all 57 cells.
(c) Fluorescence traces from selected cells showing partially synchronized subthreshold oscillations. Extracted at the time point indicated by the red arrow in (b).
(d) Example fluorescence traces from 2 selected cells during the entire 20 min recording. See Extended Data Fig. 5c for raw fluorescence traces.
(e,f) Zoomed-in fluorescence traces from the shaded areas labeled in (c).
(g) Comparison of spike SNR during 0–1 and 18–19 min of the recording. Two-sided Wilcoxon signed rank test, *p = 3.13e−10. Box plots same as Fig. 2(e).
(h) Measured photobleaching rate across all 57 imaged cells over the 20 min recording. Box plot same as Fig. 2(e). Median/Q1-Q3, 0.34/0.25 – 0.40.

