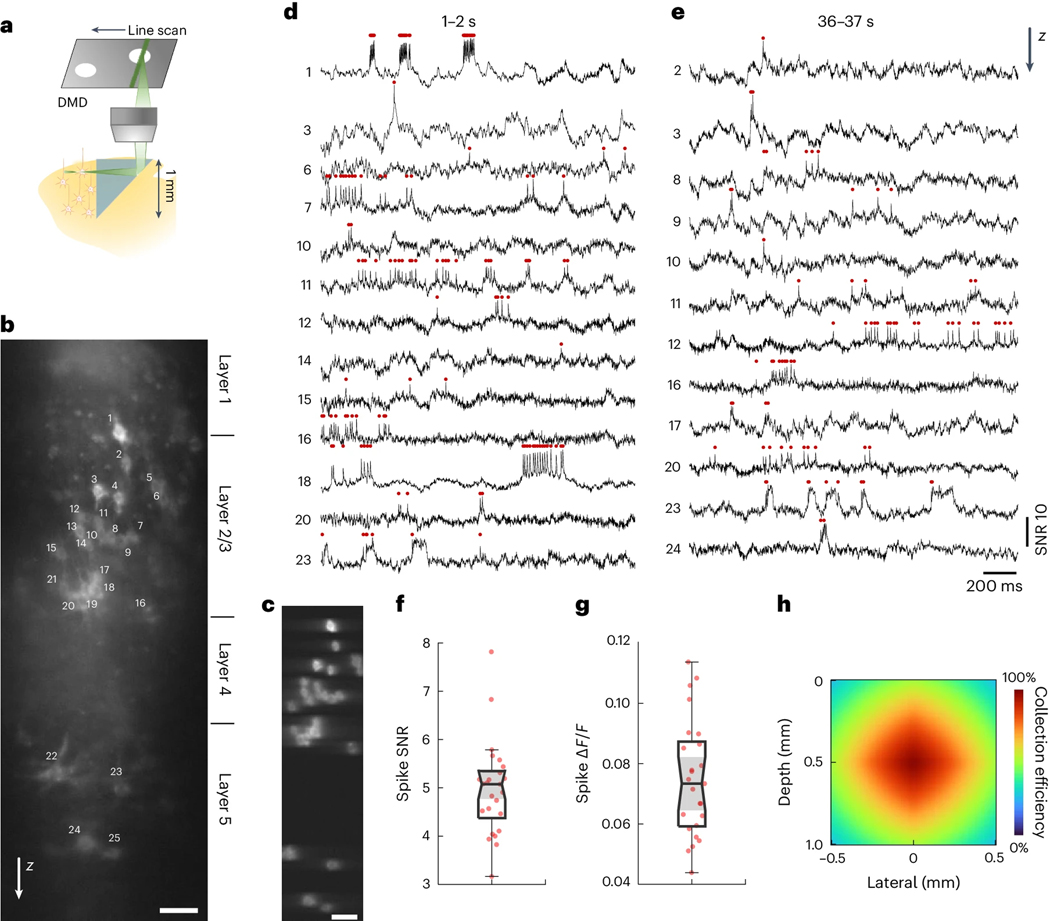
Figure 5. Side-on voltage imaging across multiple cortical layers with an implanted microprism.
(a) Schematic illustration of side-on cortical imaging with an implanted microprism.
(b) Side-on confocal image of Voltron2 fluorescence, demonstrating simultaneous view of neurons across cortical layers 1–5. Scale bar, 50 μm. Image gamma adjusted (γ = 0.3) to highlight weaker neurons.
(c) Averaged Voltron2 fluorescence image with 25 neurons targeted within the FOV. Scale bar, 50 μm. Image gamma adjusted (γ = 0.5) to highlight weaker neurons.
(d,e) Voltron2 fluorescence traces for all active neurons during 1–2 s and 36–37 s of the recording. See Extended Data Fig. 10 for the complete 45 s recording of all 25 neurons.
(f,g) Spike SNR and spike during the recording (n = 25 neurons from 1 mouse).
(h) Fluorescence collection efficiency (0.8 objective NA) when imaging through a microprism .

