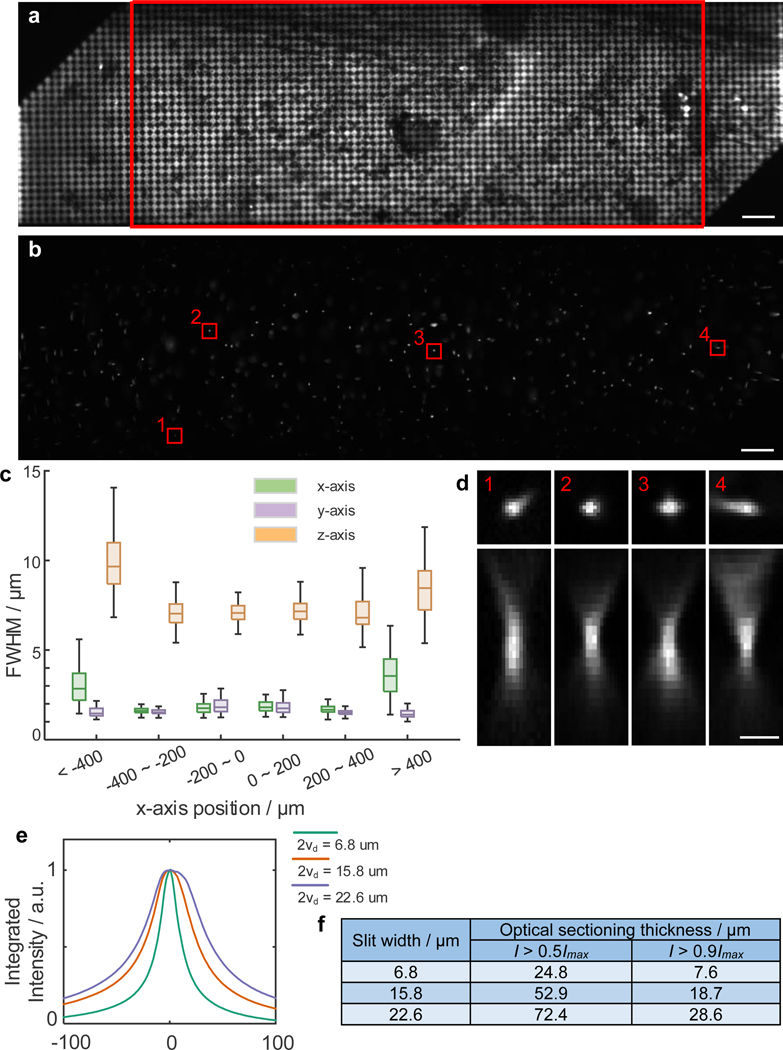
Extended Data Fig. 2. Optical performance characterization of TICO microscope.
(a) Fluorescence image of a single layer of 1 μm fluorescent beads acquired by projecting a 7.9 μm checkerboard pattern on the DMD. Note that over the full FOV of 1.16 × 0.325 mm the top left and bottom right corner are clipped due to the smaller DMD chip size. The FOV without clipping is 880 × 325 μm, indicated by the red rectangle. Scale bar, 50 μm. (b) Confocal image of 100 nm fluorescent beads over the FOV. Slit size was set to 14 μm. Scale bar, 50 μm. (c) FWHM values of PSFs across different lateral positions across the FOV. Scale bar, 50 μm. For each group from left to right, n = 92, 106, 123, 121, 124, 82 beads from 1 FOV. Box plots same as Fig. 2(e). (d) Example PSFs from the red rectangular regions shown in (b). Scale bar, 5 μm. (e) Optical sectioning profiles measured with different slit widths 2vd. Data obtained by axially translating a single layer of 1 μm fluorescent beads and measuring the integrated intensity as a function of defocus without targeted illumination. a.u., arbitrary unit. (f) Thickness of optical sections measured at a threshold of 50% or 90% of the maximum intensity.

