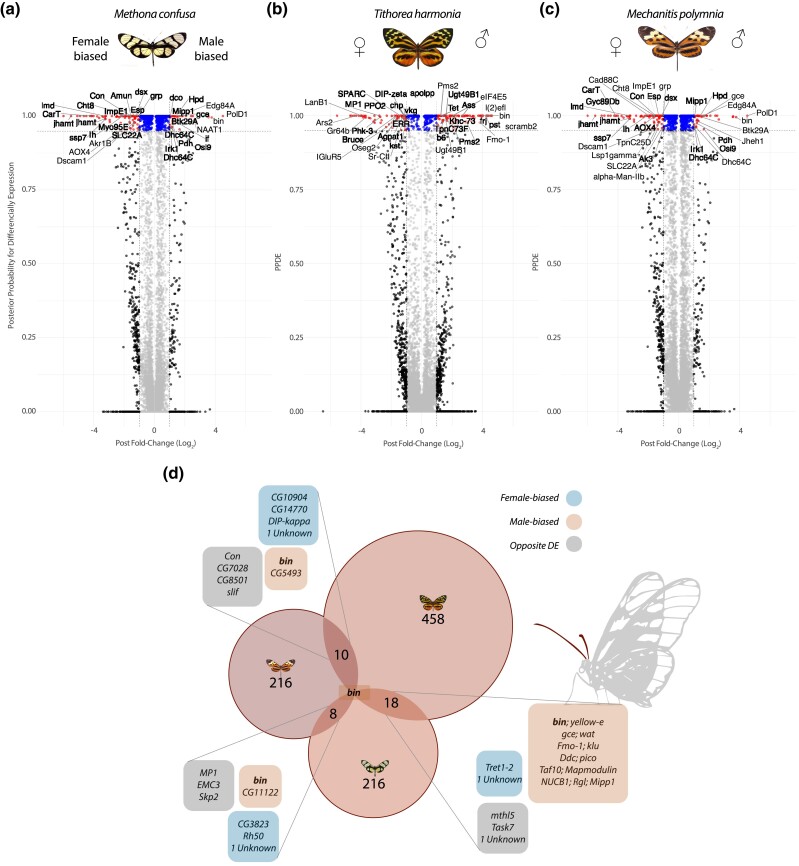
Fig. 6.
Antennal differential gene expression in the three species of Ithomiini. a to c) Volcano plots showing the relation between fold-change (FC) (log2 transformed) and their Bayes factors (BFs) of the antennal gene expression. Above the horizontal dased line there are the significantly differential expressed genes (DEGs; posterior probability > 0.95). Between the vertical dashed lines genes with a fold-change (FC) below |1|; while externally genes with a FC > |1|. For each plot, female-biased and male-biased genes are on the left and right, respectively, for M. confusa, M. polymnia, and T. harmonia. d) Venn diagram showing the DEGs in common between species. The numbers in the main circles are the scOGs used for the comparisons. For each comparison, genes are grouped in boxes according to the concordance of expression (colored boxes) or not (gray boxes).

